Seattle asking rents, September 2026
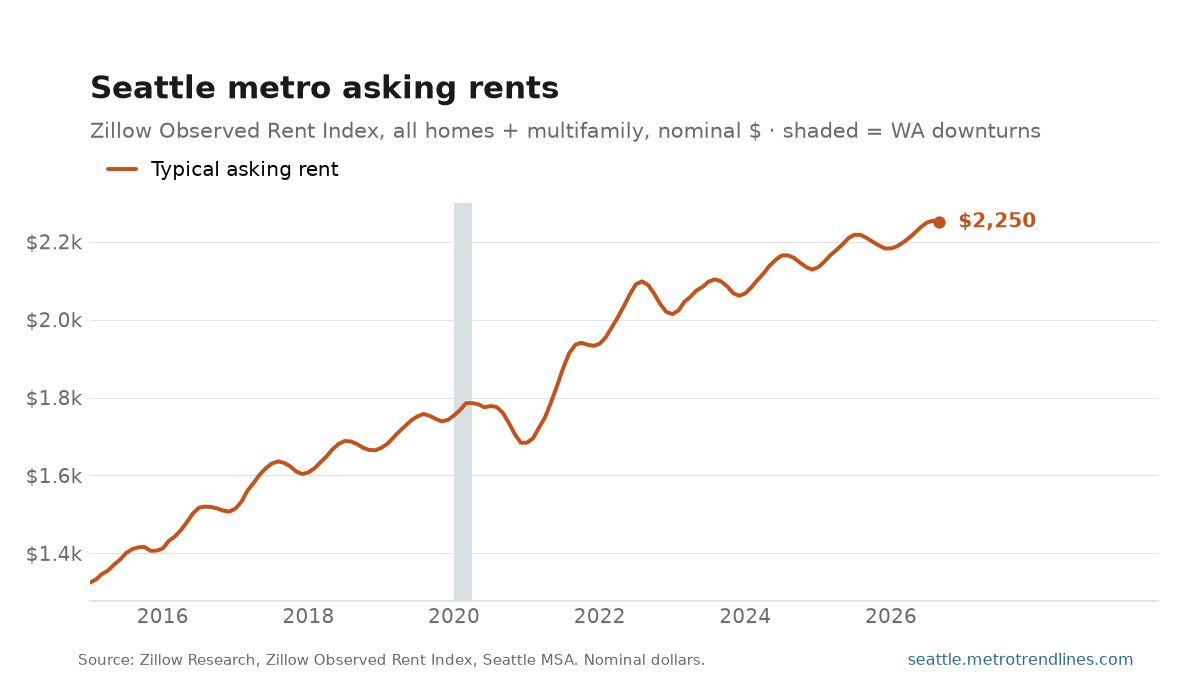
The typical asking rent in the Seattle metro was $2,250 a month in September 2026, up 1.8% from a year earlier.
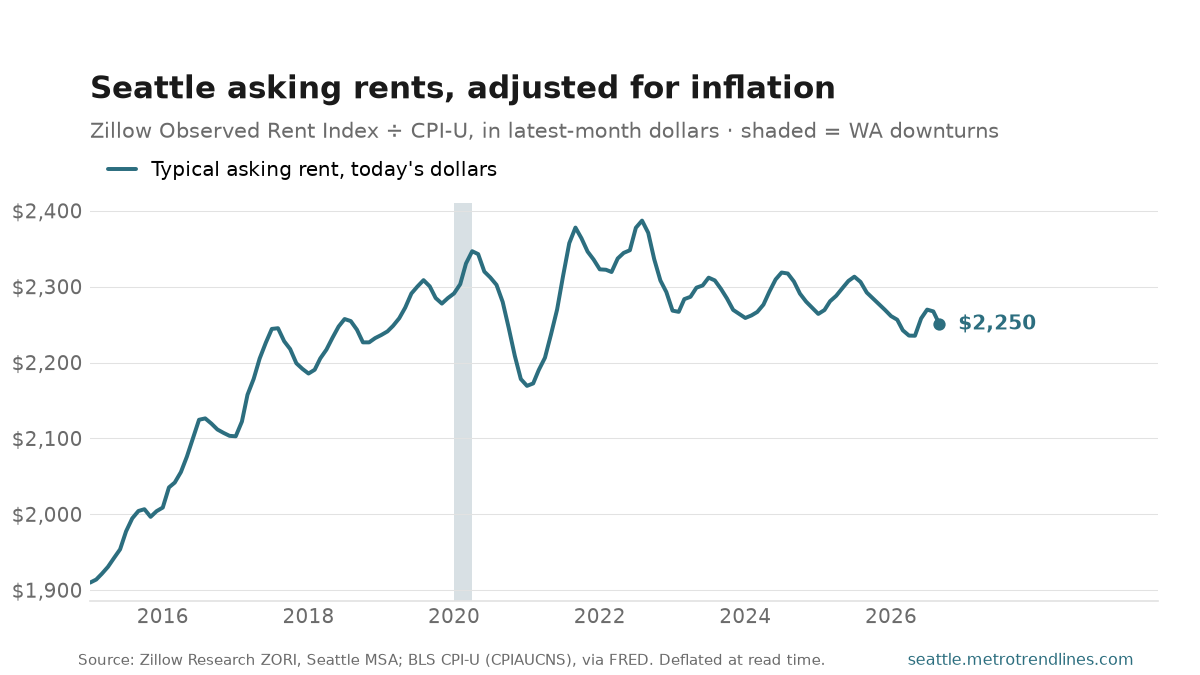
The second chart takes inflation out. The price index runs through September 2026, and in that month’s dollars the typical asking rent was $2,250, down 1.8% in real terms on the year and 6% below its real peak of $2,387 in August 2022. When the nominal line climbs and the real one does not, rents are rising more slowly than prices in general — which is not the same thing as rent getting affordable, since that depends on what renters earn.
ZORI tracks new leases, not the average rent paid across all tenants, so it turns roughly a year before the rent component of the local CPI does — which makes it the leading indicator of the two. The real series is deflated by the national CPI-U (all items, NSA) and stated in dollars of the latest month the CPI covers, so it can end a month before the nominal line. Rent is itself part of the CPI, so the real line is rent measured in purchasing power, not rent net of rent inflation.
Sources: Zillow Research, Zillow Observed Rent Index (ZORI), Seattle–Tacoma–Bellevue MSA, smoothed, all homes plus multifamily; U.S. Bureau of Labor Statistics CPI-U, U.S. city average, all items, NSA, via FRED CPIAUCNS. Real values are computed at read time. Auto-generated each build.