Seattle-metro finance jobs, September 2026
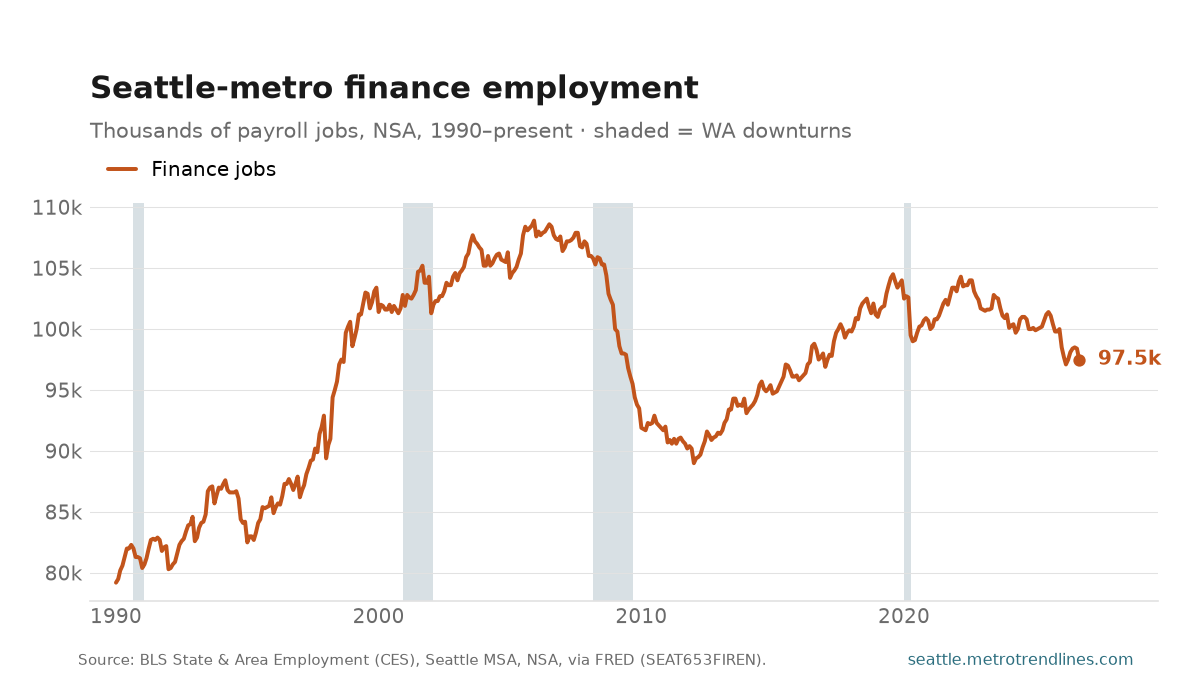
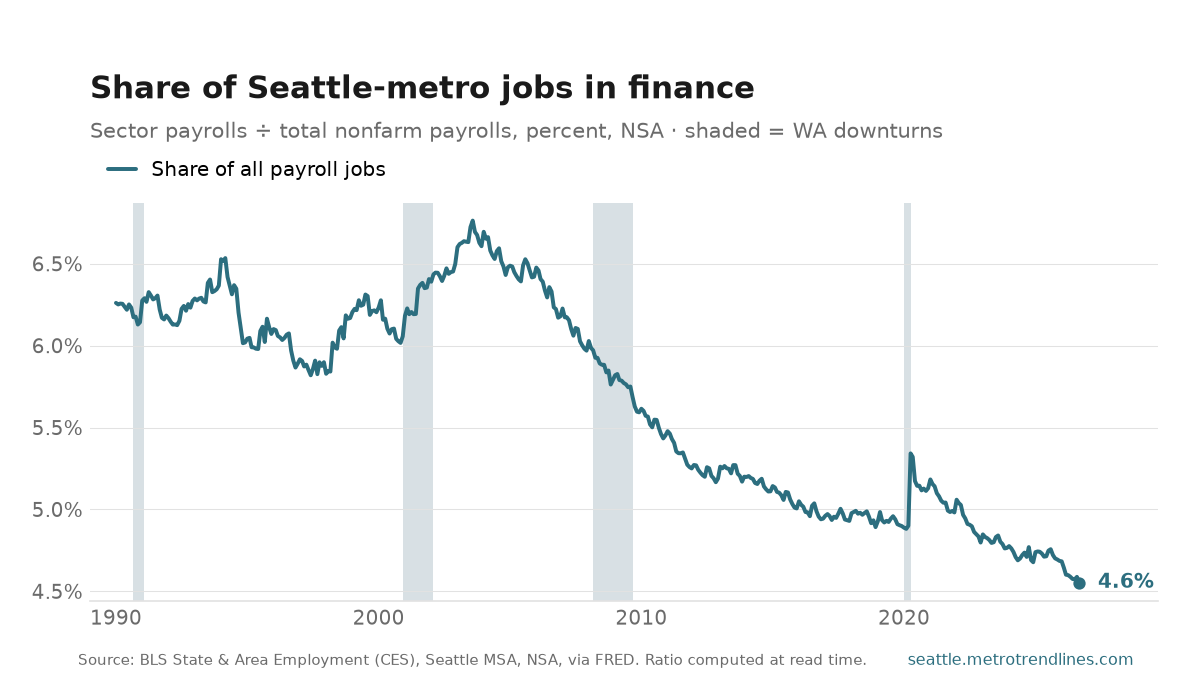
Seattle-metro financial activities employers had 97,500 people on payroll in September 2026, down 2.9% from a year earlier. That is 4.6% of all payroll jobs in the metro, against 4.7% a year before.
Finance and insurance plus real estate, rental and leasing — banks, insurers, mortgage lenders, brokers and property managers. Seattle’s version of this sector was shaped by the mortgage boom of the 2000s and by Washington Mutual, headquartered here until its failure in 2008, and it has never regained that weight. Real estate and lending also make it sensitive to interest rates in a way most sectors are not.
The two charts answer different questions. The count peaked at 108,900 in December 2005 and says whether the sector is hiring. The share — from 6.3% in January 1990, with a high of 6.8% in August 2003 and a low of 4.6% in September 2026 — says whether it is growing faster or slower than the rest of the economy.
Not seasonally adjusted, so compare a month with the same month a year earlier. The share is computed at read time from two series in the same BLS release, so it stays consistent when the levels are revised.
Source: U.S. Bureau of Labor Statistics, State & Area Employment, financial activities and total nonfarm payrolls, Seattle–Tacoma–Bellevue MSA, not seasonally adjusted, via FRED (SEAT653FIREN, SEAT653NAN). The share is derived at read time. Auto-generated each build.