The Ports of Seattle and Tacoma compete no longer: in 2015 they merged their marine-cargo operations into The Northwest Seaport Alliance (NWSA), which since then reports the two harbors as one gateway. So this is a single combined line — there is no public Seattle-versus-Tacoma container split after 2015.
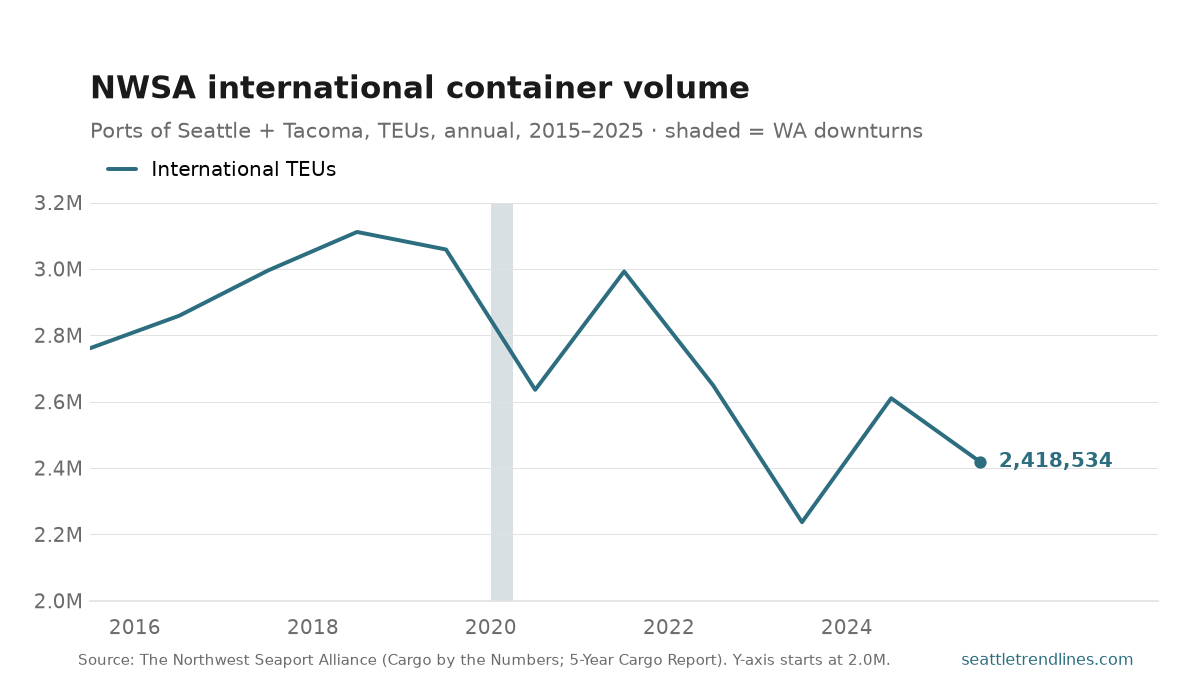
NWSA handled 2,418,534 international TEUs in 2025, down 7.3% from 2024. That is the second-lowest annual total since the 2015 merger — above only the 2.24 million trough of 2023 — and it leaves container volume 22% below the 2018 peak of 3.11 million and 13% below where it stood in 2015.
The shaded band marks Washington’s only economic contraction of the period, the early-2020 COVID downturn. Unlike the city’s population, the docks felt it: international volume dropped 13.8% in 2020. It then snapped back in the 2021 import boom to 2.99 million, before three of the next four years moved lower as imports normalized and 2025’s tariff pressure and elevated retail inventories cut into the full-container trade.
Splitting the loaded boxes apart shows two different stories.
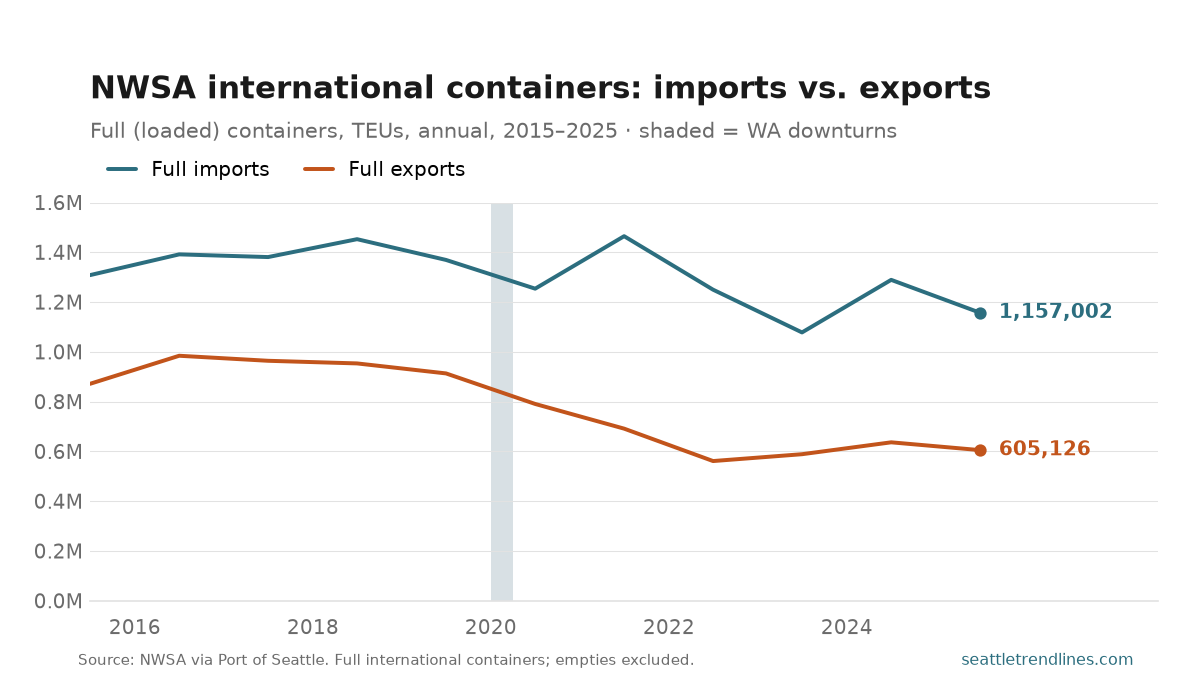
Full imports have held in a 1.1–1.5 million band: they spiked to 1.46 million in the 2021 import boom, then unwound, falling 10.3% in 2025 to 1,157,002. Full exports have done something more durable — drifted down for a decade, from a 2016 peak of 984,274 to 605,126 in 2025 (−4.9% on the year), a 39% slide from that peak. The result: the gateway’s import-to-export ratio has widened from 1.5 in 2015 to 1.9 today, and in recent years NWSA now ships back more empty boxes than it fills with exports.
Two caveats on the number. It counts international containers only — full imports, full exports, and empties — and excludes domestic Alaska and Hawaii traffic of roughly 0.73 million TEU a year; including it, NWSA’s 2025 grand total was about 3.16 million, down 5.5% on the year. And because the ports report jointly, the long Seattle-versus-Tacoma rivalry that ran through the 1990s and 2000s can no longer be drawn as two lines.
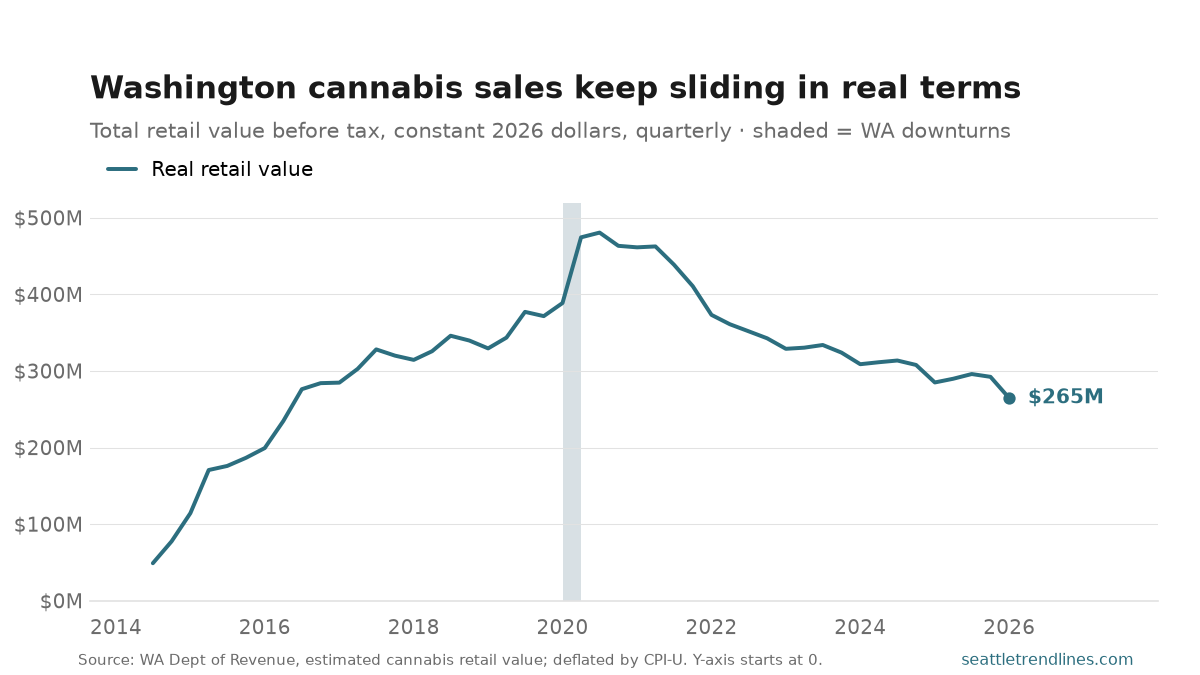
Legal cannabis arrived in Washington in July 2014. In today’s dollars, sales went almost straight up for six years — from $49M in the first quarter to a peak of $481M in 2020 Q3 — and have been sliding ever since. The latest reading, $265M in 2026 Q1, is 45% below that peak and down 7.2% from a year earlier. (All figures here are inflation-adjusted to constant 2026 dollars; in unadjusted dollars the peak was a smaller-looking $381M and the drop from it about 31%.)
The 2020 spike was real: cannabis was deemed essential, stores stayed open, and stuck-at-home demand pushed real sales up about 27% year-over-year. The shaded band marks Washington’s only economic contraction inside this window — the 2020 COVID downturn — and cannabis is the rare series that climbed straight through it. But the boom didn’t outlast the pandemic. In real terms, annual sales peaked at $1.81 billion in 2020 and have fallen every year since, to $1.16 billion in 2025.
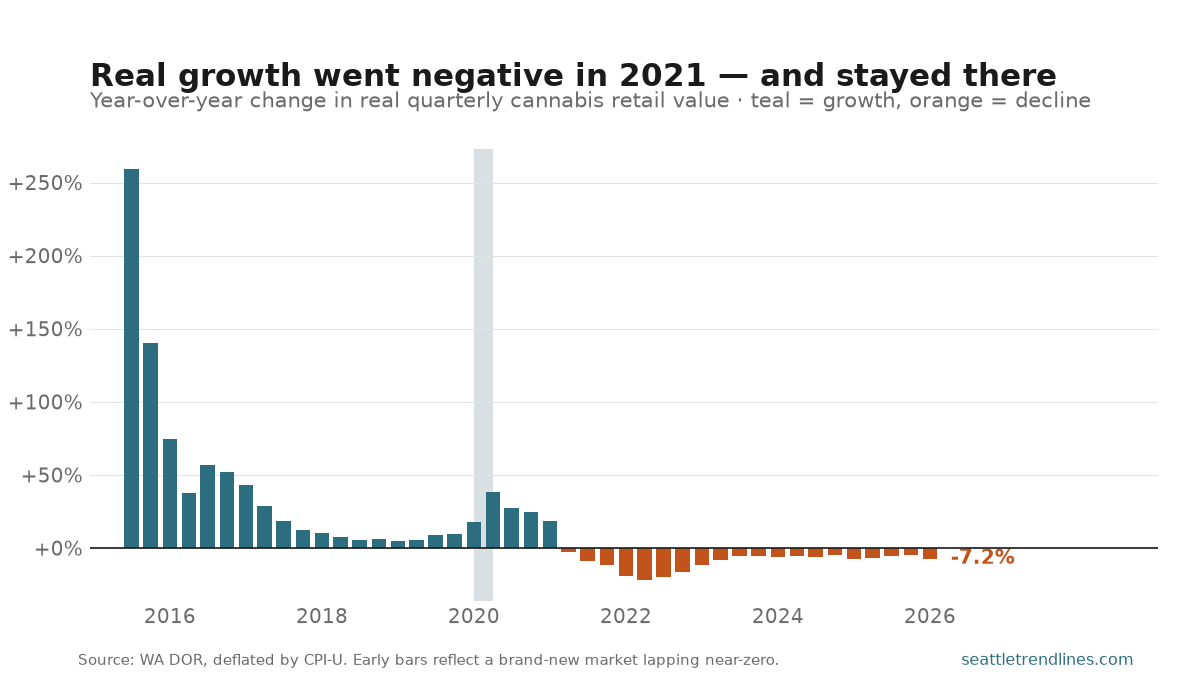
That is the real story: adjusted for inflation, Washington’s cannabis market has shrunk year-over-year for 20 straight quarters — every quarter since spring 2021. Nominal dollars hide it, because rising prices flatter the recent numbers; the unadjusted series is “only” down about 31% from peak. Falling retail dollars also understate what’s moving off the shelf — Washington’s per-gram cannabis prices have dropped sharply since 2014, so the state is almost certainly selling far more product for that shrinking pile of money.
One structural break is worth flagging. Through mid-2016 the series blends two channels: licensed I-502 recreational stores and medical “collective gardens.” The Cannabis Patient Protection Act shut the collectives down on July 1, 2016, folding medical patients into the licensed retail system — which is why the early-2016 composition shifts even as the total keeps climbing.
Across nearly twelve years, Washington’s legal market has rung up about $14.7 billion in retail sales measured in today’s dollars (roughly $12.3 billion unadjusted).
Source: WA Department of Revenue, “Recreational and medical cannabis taxes” — Estimated Sales Tax Collected on Sales of Cannabis (XLSX), quarterly total retail value before tax, prepared by DOR’s Research & Fiscal Analysis Division. Deflated to constant 2026 dollars using CPI-U, U.S. city average, all items, NSA (BLS: CUUR0000SA0). The 37% cannabis excise tax is administered by the WA Liquor and Cannabis Board. Quarterly; DOR states each quarter is static and not revised. Next update: DOR posts 2026 Q2 in roughly August 2026.
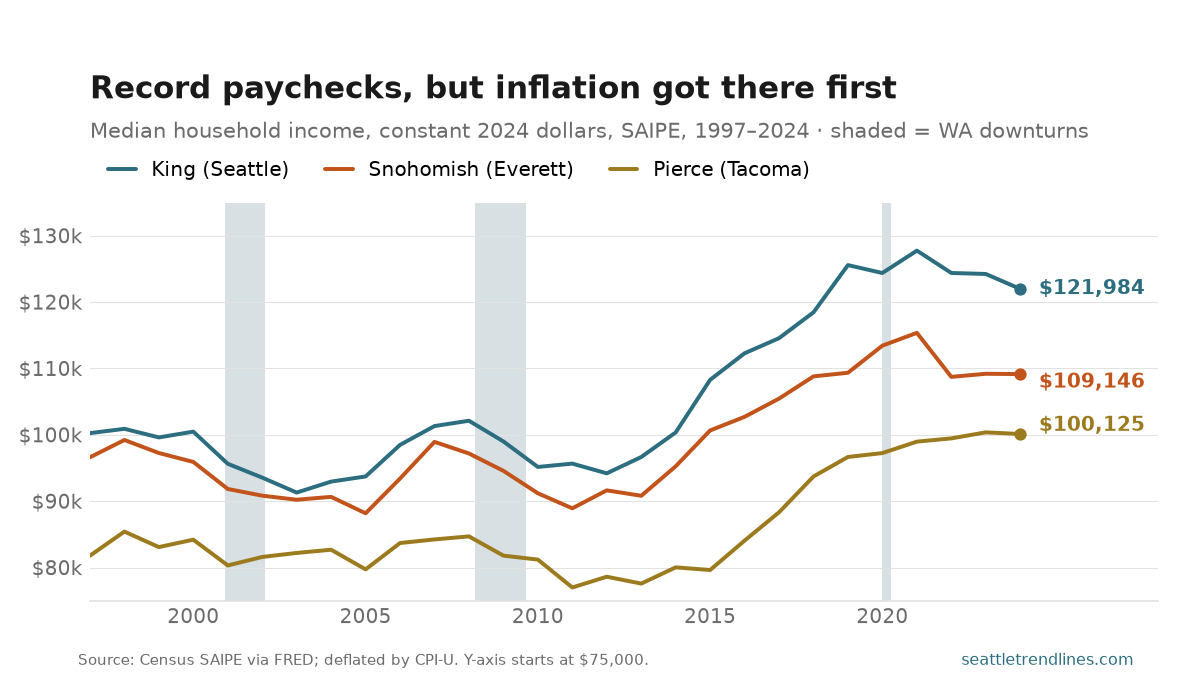
The headline number keeps setting records. King County’s median household income reached $121,984 in 2024 — the highest in the SAIPE series, and up about 1% on the year in plain dollars. Pierce ($100,125) and Snohomish ($109,146) also printed nominal records.
Adjust for inflation and the picture inverts. In constant 2024 dollars, King County’s median income peaked in 2021 at about $128,000 and has fallen every year since — to $124,400, then $124,200, and now $122,000, about 4.5% below the peak. The 2024 reading is a 1.8% real decline even as the nominal figure rose: prices simply went up faster than the median paycheck. Snohomish traces the same arc from its own 2021 peak; Pierce, the late bloomer, didn’t peak until 2023 and has roughly held there.
Step back and the long sweep is two different eras. From the late-1990s through 2012, real median income in King County went nowhere — by 2012 it was about $94,000 in today’s dollars, actually below its 1997 level of roughly $100,000, with the dot-com and Great Recession downturns bracketing a lost decade and a half. Then the cloud-and-platform boom hit: real income climbed more than a third from the 2012 trough to the 2021 peak. The recent slip is small against that run, but it is the first sustained real decline since the recovery began — and with local inflation back near 5%, the 2025 estimate will have a high bar to clear.
The county ranking has barely budged. King has paid the most throughout, running about 22% above Pierce in both 1997 and 2024 — three decades of growth that lifted all three counties without rearranging them.
Source: U.S. Census Bureau, Small Area Income and Poverty Estimates (SAIPE), median household income, retrieved via FRED (King, Pierce, Snohomish). SAIPE are model-based single-year estimates; values are dated to the income year. Inflation adjustment uses the CPI-U (U.S. city average, all items, NSA, annual average), constant 2024 dollars. State downturns: Philadelphia Fed Coincident Economic Activity Index for Washington. SAIPE 2024 estimates were released in December 2025; the 2025 vintage is due around December 2026.
The Seattle metro economy — King, Snohomish, and Pierce counties — produced $488 billion of real output in 2023, the most recent year the Bureau of Economic Analysis publishes for metro areas. That is up 6.2% from 2022, which the BEA ranked as the fastest growth of any U.S. metro with more than 1.5 million people (Houston was next, at 5.4%). Information and tech alone generated $133.7 billion of it.
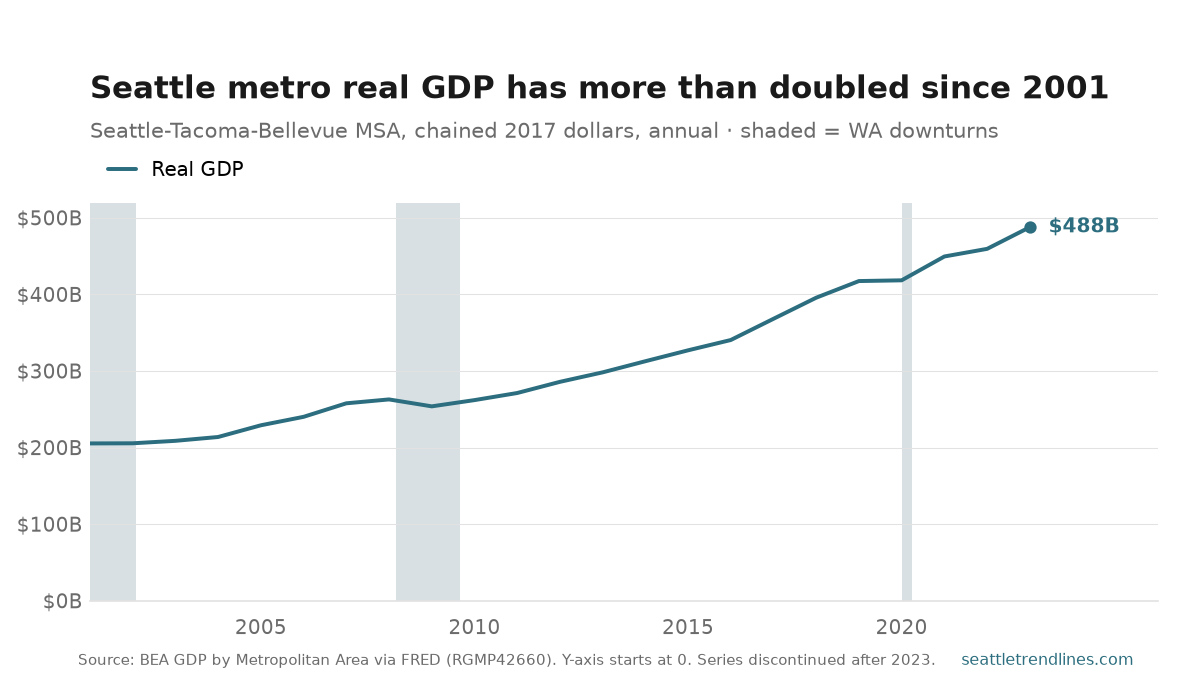
Real output has grown 2.4-fold since 2001, from $205 billion. The line bends upward after 2016: the cloud-and-Amazon stretch of 2017–2019 added real growth of 8.2%, 7.5%, and 5.5% in consecutive years, the strongest run in the series.
What stands out against the shaded bands is how little the contractions bit. The 2001 dot-com bust — which hit tech towns hard — left Seattle’s real GDP essentially flat (about +0.1% in both 2001 and 2002) rather than shrinking. The only outright annual decline in twenty-three years came in 2009, down 3.4% in the Great Recession, and it was erased by 2011.
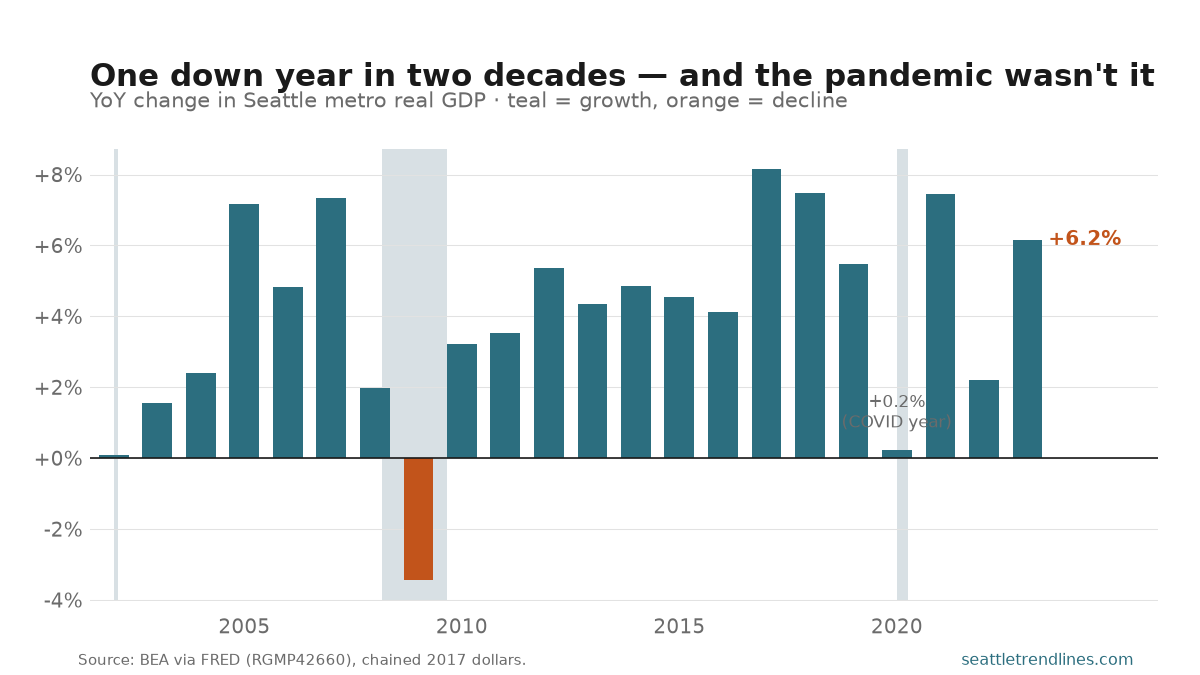
The pandemic is the real tell. Most metros’ output fell in 2020; U.S. real GDP dropped about 3.5% that year. Seattle’s rose 0.2% — flat, but on the right side of zero — because the things that power this economy (cloud services, software, e-commerce logistics) were precisely the things that boomed while people stayed home. Growth then resumed at 7.4% in 2021.
Two caveats. This is real GDP in chained 2017 dollars, so the doubling is genuine output growth, not inflation; in current dollars the 2023 figure is a larger-looking $566.7 billion. And 2023 is the end of the line: the BEA has discontinued its metropolitan-area GDP series, so there is no official 2024 or 2025 metro number to add — only the underlying county estimates, released on a lag.
Source: U.S. Bureau of Economic Analysis, GDP by Metropolitan Area (real GDP, all industries, chained 2017 dollars), accessed via FRED series RGMP42660 (real) and NGMP42660 (nominal). Geography: Seattle-Tacoma-Bellevue, WA MSA (CBSA 42660 = King, Snohomish, and Pierce counties). The “fastest among large metros” ranking and the $133.7B tech/information figure are from BEA’s December 4, 2024 release, as reported by Axios Seattle. State downturns: Philadelphia Fed Coincident Economic Activity Index for Washington via FRED. Annual; BEA released 2023 metro estimates in December 2024 and has since paused MSA-level publication.
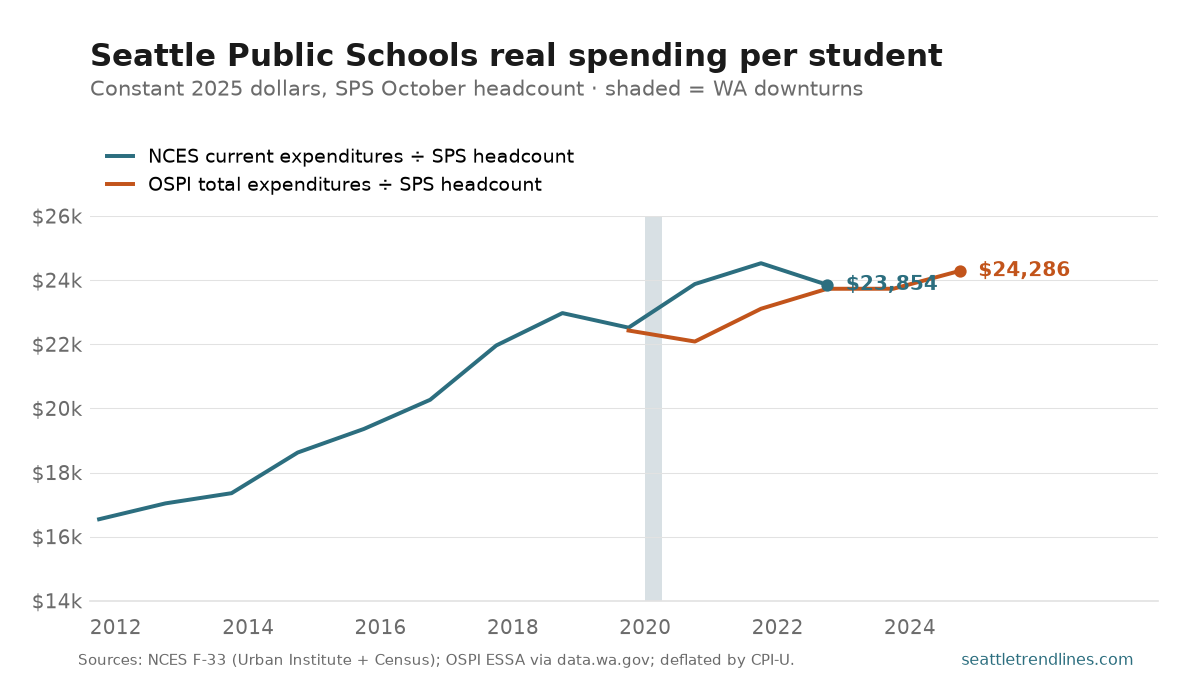
Measured against the district’s own October headcount, real spending per pupil climbed from about $16,500 in 2011–12 to $24,286 in 2024–25 (constant 2025 dollars) — roughly a 47% real increase, driven by the post-McCleary funding surge of the mid-2010s, with growth cooling since.
The shaded band is where the two independent sources overlap (2019–20 through 2022–23). At both ends of that window they agree almost exactly — within 0.4% in 2019–20 and 0.5% in 2022–23. In between, the federal NCES “current spending” line jumps 6–8% above the state’s ESSA-based line: that’s the wave of pandemic ESSER relief, which the NCES measure books in full while OSPI’s ESSA figure excludes part of it. By 2022–23, with relief winding down, the two reconverge. It’s a clean illustration that which spending definition you use matters most exactly when a one-time funding shock hits. (Y-axis starts at $14,000.)
The two measures, and why use both:
NCES current expenditures ÷ SPS headcount. Federal F-33 operating expenditures (Urban Institute through 2019–20, U.S. Census Bureau for 2020–21 to 2022–23), over SPS’s October count. Plus: a standardized, nationally comparable definition with a long back-run; the two F-33 sources match within 0.2% where they overlap. Minus: still released with a lag (ends 2022–23), and it fully books one-time federal surges like ESSER.
OSPI total expenditures ÷ SPS headcount. Washington’s ESSA expenditure total over the same headcount. Plus: state-official and current through 2024–25. Minus: ESSA accounting excludes some spending (so it understates the ESSER years), and it only begins in 2019–20.
Using SPS headcount as the common denominator (rather than NCES fall membership or OSPI’s annual-average FTE) raises the per-pupil figure by roughly 3% and is the most locally meaningful count — but it’s why this view starts in 2011–12, the first year of consistent district headcount.
Sources: NCES Common Core of Data district finance survey (F-33), current expenditures, via the Urban Institute (through 2019–20) and the U.S. Census Bureau School System Finances API (2020–21 to 2022–23); OSPI ESSA per-pupil expenditure (total expenditures, data.wa.gov, 2019–20 to 2024–25); both divided by SPS October headcount. Deflated by BLS CPI-U (annual average). Overlap agreement: 2019–20 +0.4%, 2022–23 +0.5%; pandemic years 2020–21 +8.1%, 2021–22 +6.1%. Annual; OSPI posts the new school year each winter (2025–26 expected early 2027).
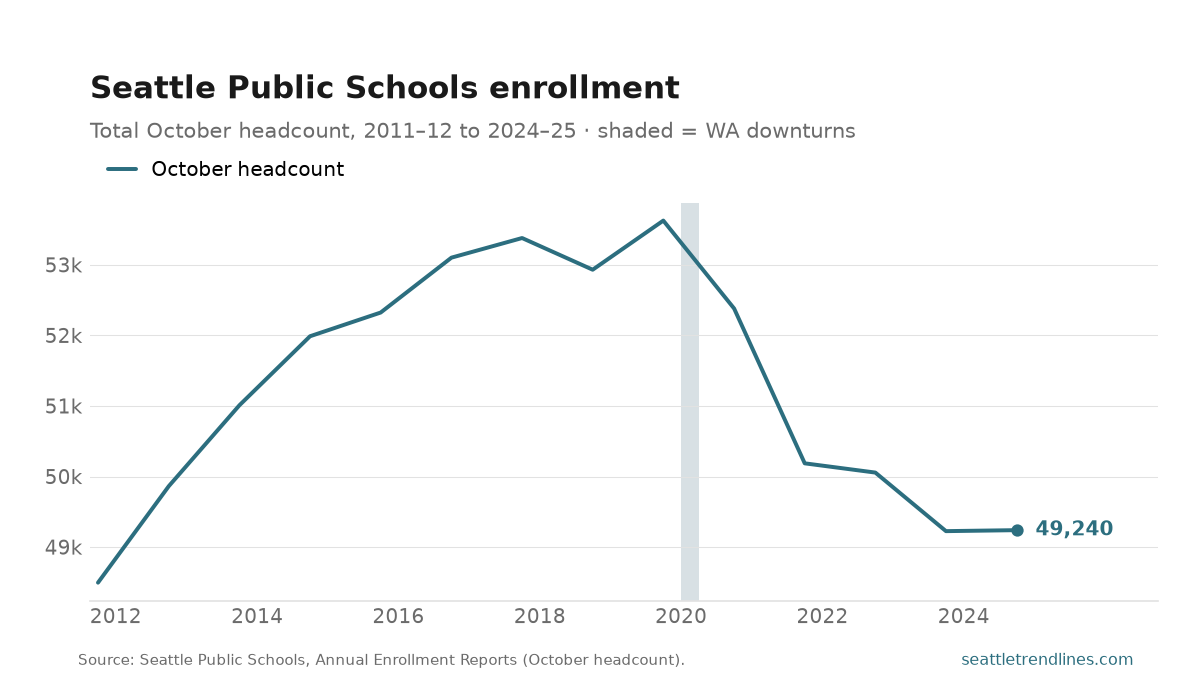
Enrollment peaked at 53,627 students in 2019–20, then fell sharply over the next two years. By 2024–25 the district counted 49,240 — down about 4,400 students, or 8%. It has roughly leveled off since 2022–23.
Source: Seattle Public Schools, Annual Enrollment Reports (October headcount). Annual; the 2025–26 count is expected in the next report, typically released the following spring/summer.
For four years the defining fact of the King County housing market was scarcity: inventory fell to a low of 746 active listings in January 2022, and bidding wars followed. That era is over. At the end of June 2026 there were 6,913 homes for sale — the highest count in the decade Realtor.com has tracked the county, the fourth straight month to set a series record, and 19% more than a year earlier.
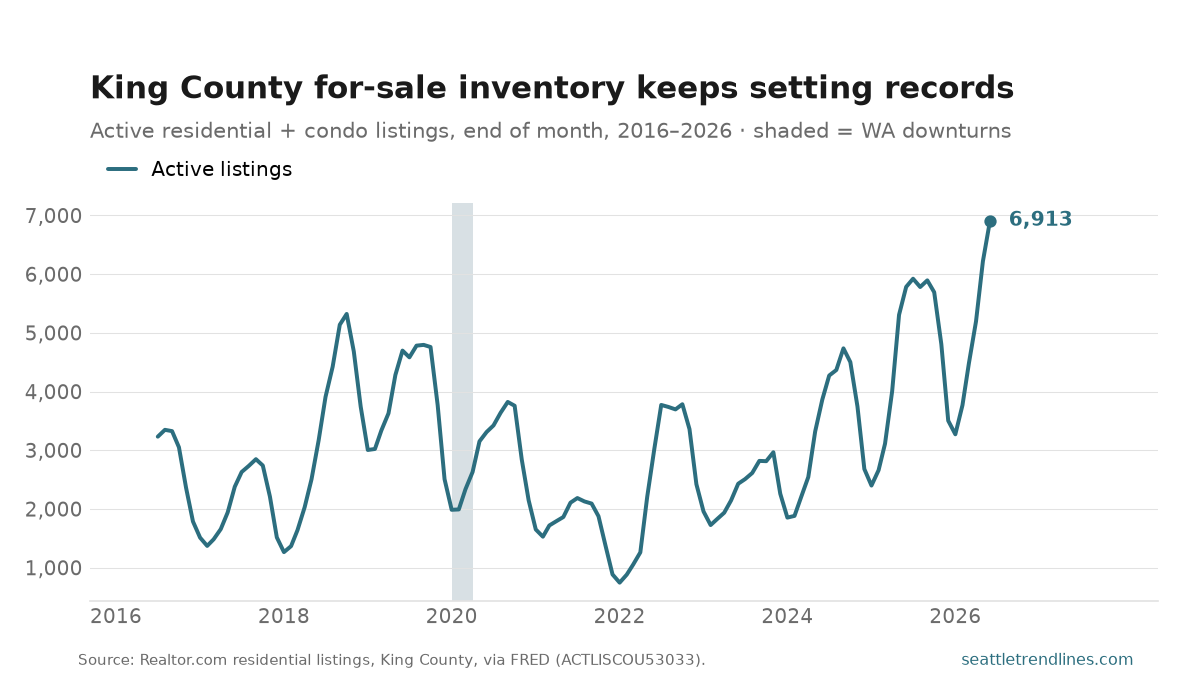
Inventory is seasonal — it builds through spring and summer, thins in winter — so the cleaner signal is the year-over-year climb, which has now run for several spring seasons. Supply is rebuilding faster than demand: the Northwest MLS put the county at roughly 3.4 months of inventory in May, still under the four- to-six months most consider balanced, but the loosest in years. The permit pipeline turning back up suggests more supply behind it.
Prices have not followed inventory down by much. The median list price was $850,000 in June 2026 — off 4% from a year earlier and about 10% below the $949,248 peak of May 2022, but still roughly 50% above where the series began in 2016.
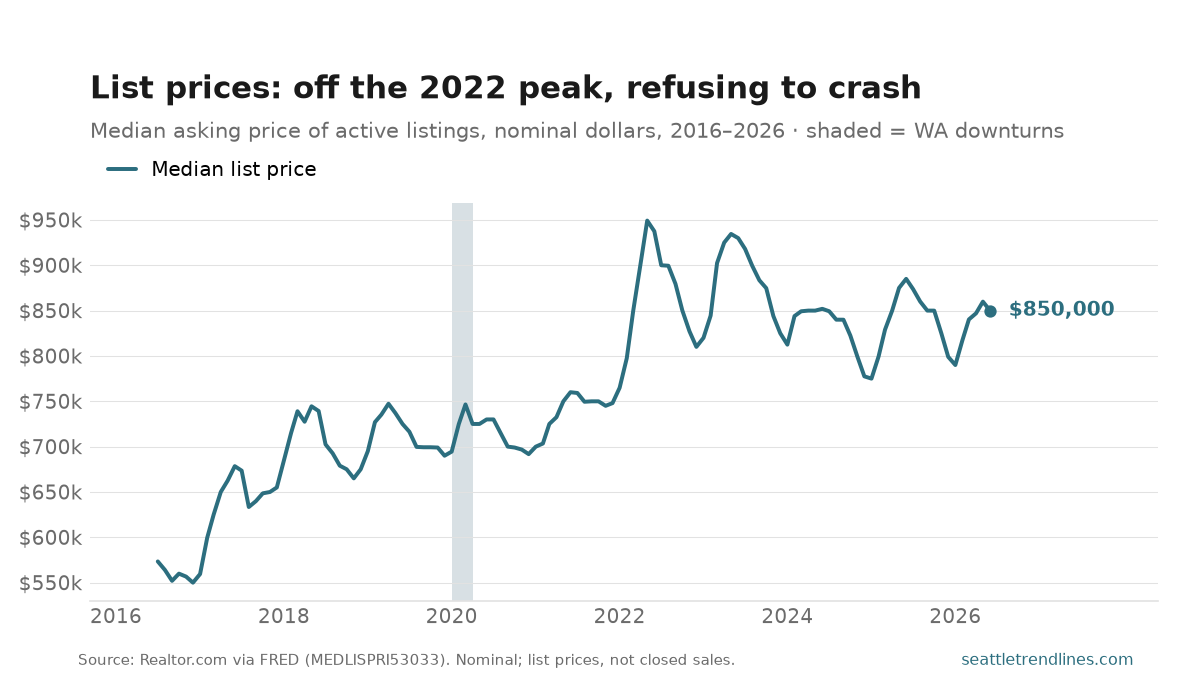
The market’s pace has settled rather than seized: the median listing sits 37 days before going under contract, about the same as a year ago and a week slower than two springs back. More homes, on the market a little longer, with prices drifting down — a buyer’s market by the standards of the last decade, even if it would not have looked like one in 1995.
Two caveats on the source. First, these are list prices from active listings, not closed-sale prices: for the actual transacted figure, the Northwest MLS reported a King County median sale price of $875,000 in May 2026 — close to the list-price line, and the number to cite when a local sale price is needed. We chart the Realtor.com/FRED listing series because it is clean, current, and free to republish with attribution; NWMLS’s own statistics carry terms that restrict derivative charts. Second, this chart is nominal — unlike the blog’s usual inflation-adjusted dollar charts — because list prices are the number buyers and sellers actually negotiate; in real terms the pullback from the 2022 peak is larger.
Source: Realtor.com Residential Listings for King County, WA (FIPS 53033), via FRED — active listings, median list price, median days on market. Closed-sale figures: Northwest MLS Monthly Market Snapshot (May 2026). State downturns: Philadelphia Fed Coincident Index for Washington. Monthly; FRED posts each month’s figures early the following month, and this chart refreshes on the next daily build.
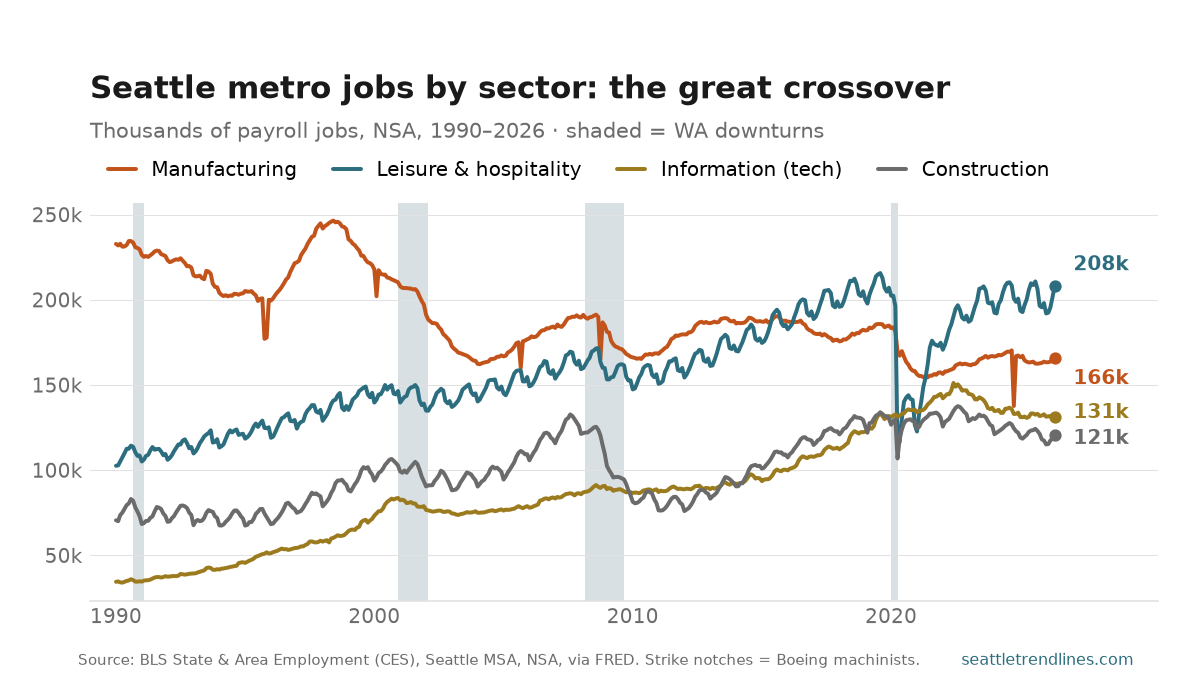
Thirty-six years ago, the Seattle metro economy was a manufacturing town: Boeing and its suppliers employed about 233,000 people in 1990, while the Information sector — software, publishing, telecom, the bucket that holds “tech” — was a rounding error at 34,500. Those two lines have spent a generation converging, and a third, leisure and hospitality, has quietly passed them both.
The story in one chart. Manufacturing (the Boeing cycle) has lost about a third of its 1990 workforce, sliding to 165,800 by May 2026; the violent single-month notches in 1995, 2005, 2008, and again in October 2024 are machinist strikes, visible because this series is not seasonally adjusted. Information climbed almost without interruption for thirty years — the Microsoft-then-Amazon ascent — peaking near 151,000 in mid-2022. It then fell for three consecutive years to the low 130s, off roughly 13% from that peak: the local fingerprint of the 2023–2025 tech retrenchment. Leisure and hospitality took the hardest pandemic hit of any sector, collapsing from about 202,000 to 114,400 in a single month in spring 2020, but it has not only recovered — at a record 208,200 it is now the largest of these four, having overtaken a diminished manufacturing sector around 2015. Construction remains the cyclical one, up from 71,000 in 1990 to 120,900 but well off its 2022 high as higher rates bit — the permit slump made flesh.
Year over year the picture matches the stalled total: payrolls were 2.14 million in May 2026, flat on the year. Manufacturing (+1.6%) and leisure (+1.2%) edged up, construction fell 1.3%, and information was essentially unchanged (−0.1%) — which, after three years of decline, is itself a kind of news: the tech slide has stopped, at least for now.
A note on the construction line: FRED discontinued the seasonally-adjusted Seattle-MSA construction series at the end of 2024, so this is the mining, logging, and construction supersector, not seasonally adjusted. In this metro, mining and logging are negligible, so the line reads as construction.
Source: U.S. Bureau of Labor Statistics, State & Area Employment (CES), Seattle–Tacoma–Bellevue MSA, not seasonally adjusted, via FRED — Information, Manufacturing, Mining/Logging/Construction, Leisure & Hospitality, Total nonfarm. State downturns: Philadelphia Fed Coincident Index for Washington. Monthly, about three weeks after month-end; this chart refreshes on the next daily build.
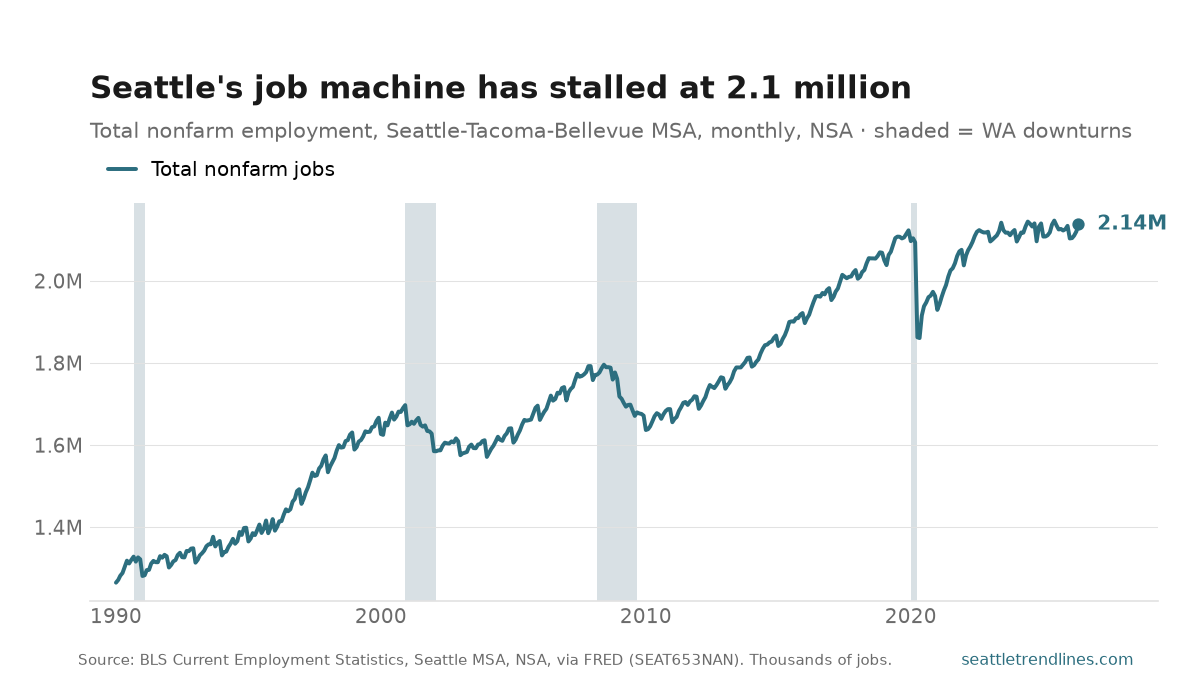
This is the region’s whole economic story on one line: 1.27 million jobs in 1990, 2.12 million now — the metro economy adding two-thirds again to its payrolls while the population grew to match. Every shock is legible. The dot-com flatline. The 2008–09 slide. The 2020 cliff — a quarter-million jobs gone in three months — followed by the fastest recovery on the chart. Even the October 2024 Boeing machinist strike shows up, a 44,000-job notch that snapped back the next month.
The right edge is the news, and the news is stillness. April’s count of 2,120,100 was up just 1,800 jobs — 0.1% — from a year earlier. Outside of recessions, this series simply doesn’t do that: year-over-year growth ran 2–3% through the 2010s and stayed positive even through the 2018–19 trade jitters. A flat year with unemployment still low reads as an economy at stall speed — not shedding workers, not hiring either. Whether that resolves into a downturn or a reacceleration is exactly what the next few months of this chart will show.
One reading note. The series is not seasonally adjusted, so the correct comparison is always to the same month a year ago — the annual sawtooth (summer peaks, January dips) is calendar, not economics. The NSA peak of 2,146,900 last June will likely be tested this summer; whether 2026 clears it is the cleanest single test of whether the stall is ending. For which industries are doing the stalling, see the jobs-by-sector breakdown.
Source: U.S. Bureau of Labor Statistics, State and Area Employment, Hours, and Earnings (CES), total nonfarm, Seattle-Tacoma-Bellevue WA MSA, not seasonally adjusted, via FRED series SEAT653NAN. Thousands of jobs, dated to the first of the month. New months post about three weeks after month-end; this chart refreshes on the next daily build.
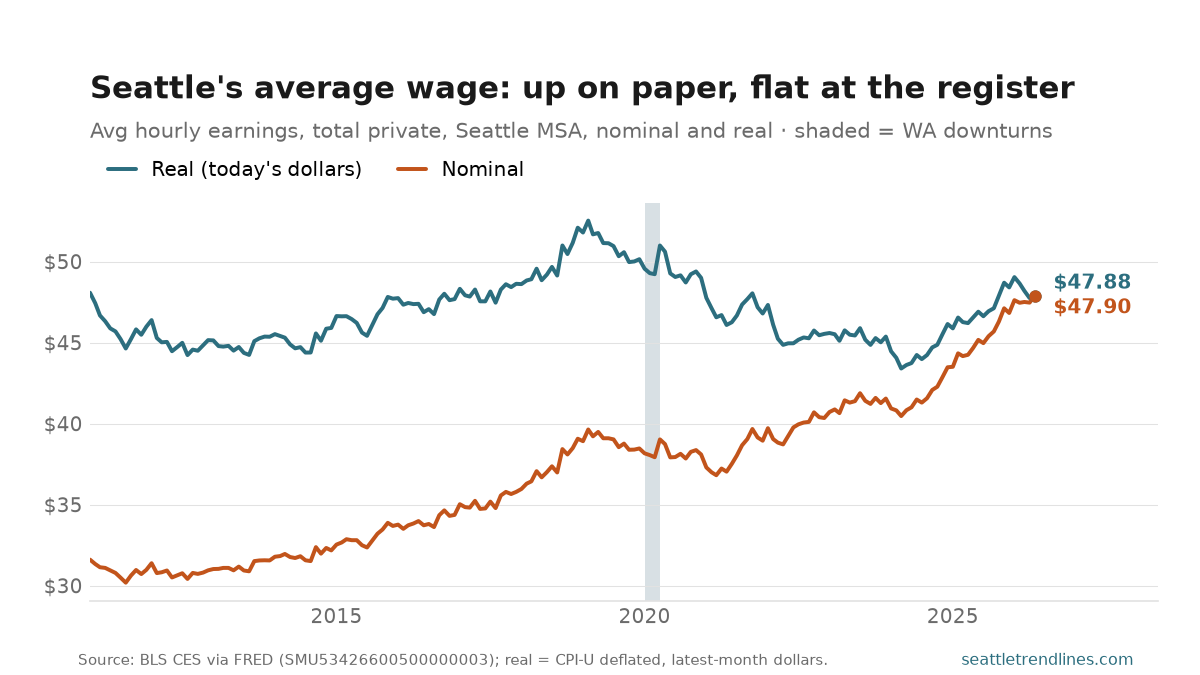
The average private-sector worker in the Seattle metro earned $47.70 an hour in May, up 6.8% from a year earlier — nominal wage growth that would have been front-page news any time in the 2010s. The teal line tells that story: pay up better than 50% since 2011, accelerating since late 2024.
The gray line tells the other one. Run the same series in today’s dollars and the average wage peaked in February 2019 at $52.55, was ground down 17% by the 2021–23 inflation to a trough of $43.42 in March 2024, and has since clawed back about 10%. Even after two years of unusually strong real gains — nominal growth near 7% against inflation near 4–5% — the average hour of work still buys about 9% less than it did in early 2019. That’s the whole inflation era in one picture: the raise arrived, and the register took it.
The caveats here are load-bearing, so read them. This is an average, not a median — it moves when the workforce changes shape, not just when anyone gets a raise. Some of the 2019 peak is exactly that: a tech-heavy boom pushing the mix upward, and some of the 2021 sag is low-wage hiring coming back. It’s also not seasonally adjusted and covers only private employees, and the series only begins in 2011. Direction and rough magnitude are trustworthy; any single month, less so. Pair it with the unemployment rate to see whether pay gains are coming from a tight labor market or a shrinking one.
Source: U.S. Bureau of Labor Statistics, State and Area Employment, Hours, and Earnings (CES), average hourly earnings of all employees, total private, Seattle-Tacoma-Bellevue WA MSA, not seasonally adjusted, via FRED series SMU53426600500000003. Real line deflated by U.S. CPI-U (CPIAUCNS) to the latest month. New months post about three weeks after month-end; this chart refreshes on the next daily build.