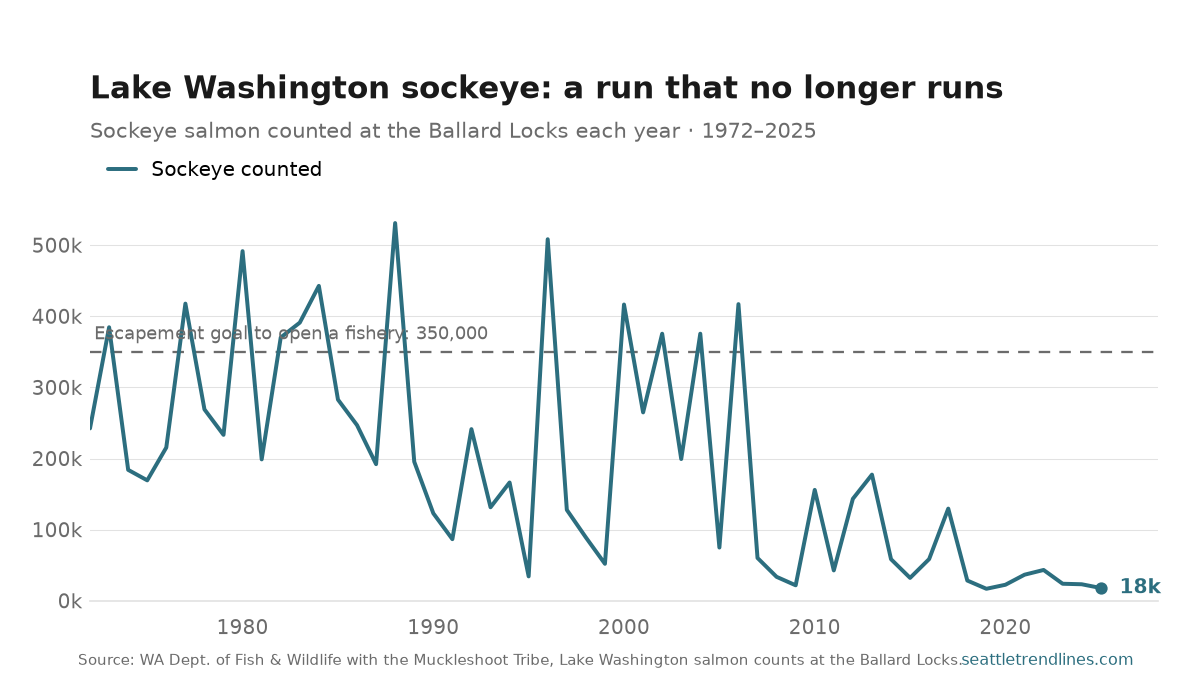
Every summer since 1972, biologists have stood at the Hiram M. Chittenden Locks — the Ballard Locks — and counted sockeye salmon one by one as they leave saltwater and climb the fish ladder toward Lake Washington. It is one of Seattle’s great free spectacles, and one of its longest-running civic data series. In 2025 the count came to 17,881 fish. In 1988 it was 531,063.
That is the whole story in two numbers, but the shape between them matters. For three decades the run was volatile but healthy, regularly swinging between 200,000 and half a million fish; the counts crossed 350,000 — the escapement threshold that has to be met before any surplus can be fished — in a dozen different years. Then, after a last big return of about 417,000 in 2006, the line steps down and stays down. The run has not reached the 350,000 goal since 2006, and the lake’s once-beloved summer sockeye fishery, which drew thousands of boats to Lake Washington in good years, has stayed closed ever since. The typical run since 2007 has been around 37,000 fish — roughly a fifth of the long-run norm.
Fisheries scientists point to a convergence of pressures rather than a single villain: lethally warm water in the Lake Washington Ship Canal that kills adult sockeye before they can spawn, disease that thrives in that warm water, poor survival in a changing ocean, and predation. A hatchery on the Cedar River was built to prop the run up, and hasn’t reversed it. The 2026 count is being tallied at the ladder as this posts — early numbers, still subject to WDFW review, point to another thin year. A run that was once big enough to fish is now watched mainly to see whether it holds on at all.
Source: Washington Department of Fish & Wildlife, Lake Washington salmon counts, conducted with the Muckleshoot Indian Tribe at the Ballard Locks. Sockeye are counted daily from June 12 through July; the annual totals shown here run 1972–2025. The 350,000 line is the escapement goal that must be met to open a fishery. Updated each summer.
What’s coming on seattletrendlines.com the week of August 3–7 — five posts on the calendar.
Monday, August 3 — Lake Washington sockeye: the run that no longer runs.
Tuesday, August 4 — Seattle-metro unemployment, June 2026.
Wednesday, August 5 — What a Seattle-area house is worth, June 2026.
Thursday, August 6 — Seattle library checkouts, July 2026.
Friday, August 7 — Seattle Fire 911 responses, July 2026.
This is the plan, not a promise. Every weekday post here is tied to a data release, and a release that slips takes its post with it — the post simply waits for the day its numbers land. A figure that arrives early, a revision worth writing about, or an unexpected story out of Seattle can just as easily add a post that isn’t on this list. Expect the week to look roughly like this, and expect at least one day of it not to.
The week of July 27–31 on seattletrendlines.com, in five posts.
Monday, July 27 — Seattle asking rents, June 2026. The typical asking rent in the Seattle metro was $2,261 a month in June 2026, up 1.3% from a year earlier.
Tuesday, July 28 — Case-Shiller Seattle, June 2026. The Case-Shiller Seattle home price index read 393.2 in June 2026 — down 1.9% from a year earlier, and 3.9× its January 2000 level.
Wednesday, July 29 — Boeing delivered 64 jets in June — 54 of them built in Puget Sound. Boeing handed over 64 commercial airplanes in June 2026, lifting first-half deliveries to 314 — its strongest first half since 2018. Fifty-four of June’s jets rolled out of Renton and Everett.
Thursday, July 30 — Seattle uses less water than it did in 1990 — with 44% more people. The SPU regional water system delivered about 170 million gallons a day in 1990 and roughly 124 by 2022 — down about 27%, even as the population it serves grew around 44%. It’s the clearest conservation success in the region’s infrastructure.
Friday, July 31 — Reported crime in Seattle, July 2026. Seattle police recorded 5,748 offenses in July 2026, down 3.7% from a year earlier, across all four NIBRS crime-against categories.
The week in review: every post from July 27–31, summarised from its own listing blurb and linked. Assembled each Saturday from the posts that actually published that week.
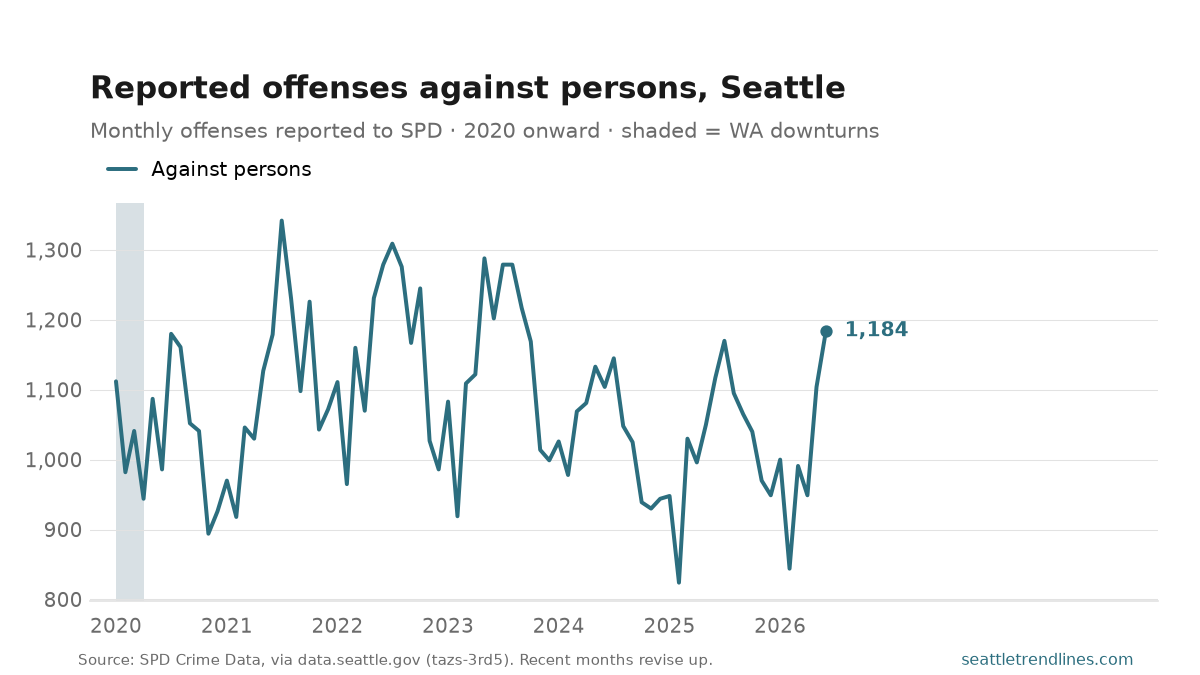
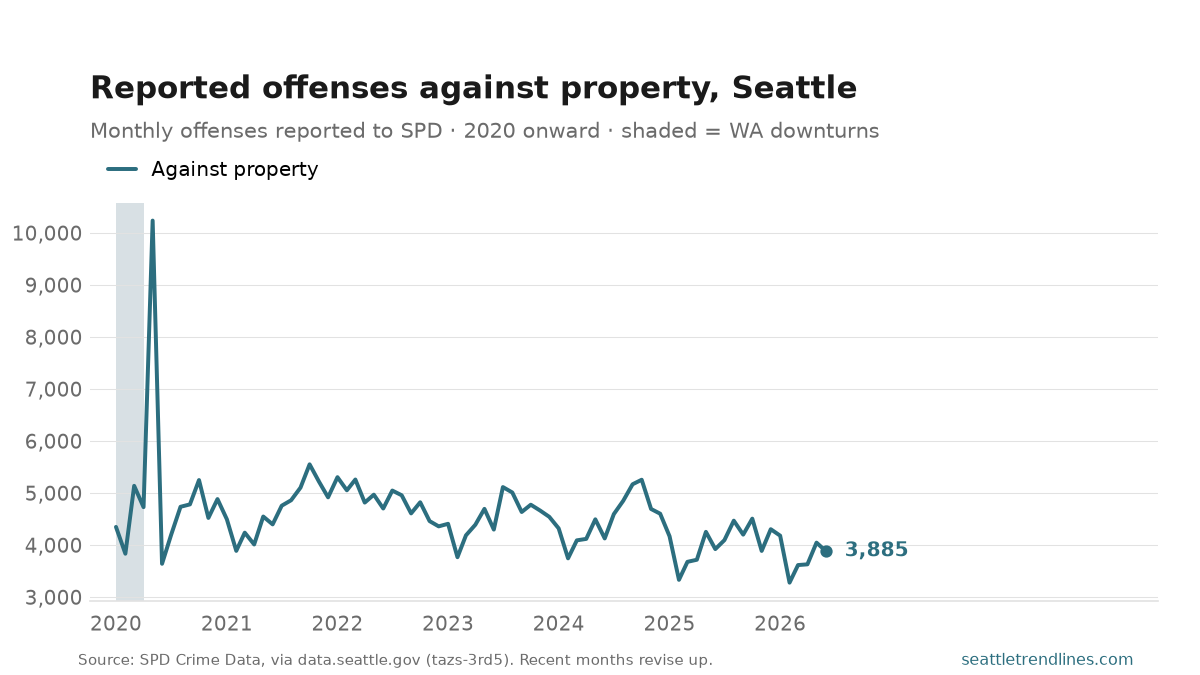
Seattle police recorded 5,748 offenses in July 2026, down 3.7% from a year earlier, across all four NIBRS crime-against categories. The charts above draw the two largest, one each: property offenses outnumber offenses against persons by roughly three to one, so on shared axes the persons line barely moves and a single ‘crime’ line mostly tracks car prowls.
Three caveats, and they matter more than the number. This counts crime reported to police, so it moves with reporting behaviour as well as with crime. It counts offenses, not incidents, and one report can carry several. And the most recent months revise upward as late reports land, so treat the right-hand edge as provisional. The chart starts in 2020 because SPD migrated records systems in 2019 and the counts on either side of that are not comparable.
Source: Seattle Police Department, SPD Crime Data 2008-Present, via data.seattle.gov (Socrata tazs-3rd5). Offenses dated by when the offense started. Auto-generated each build.
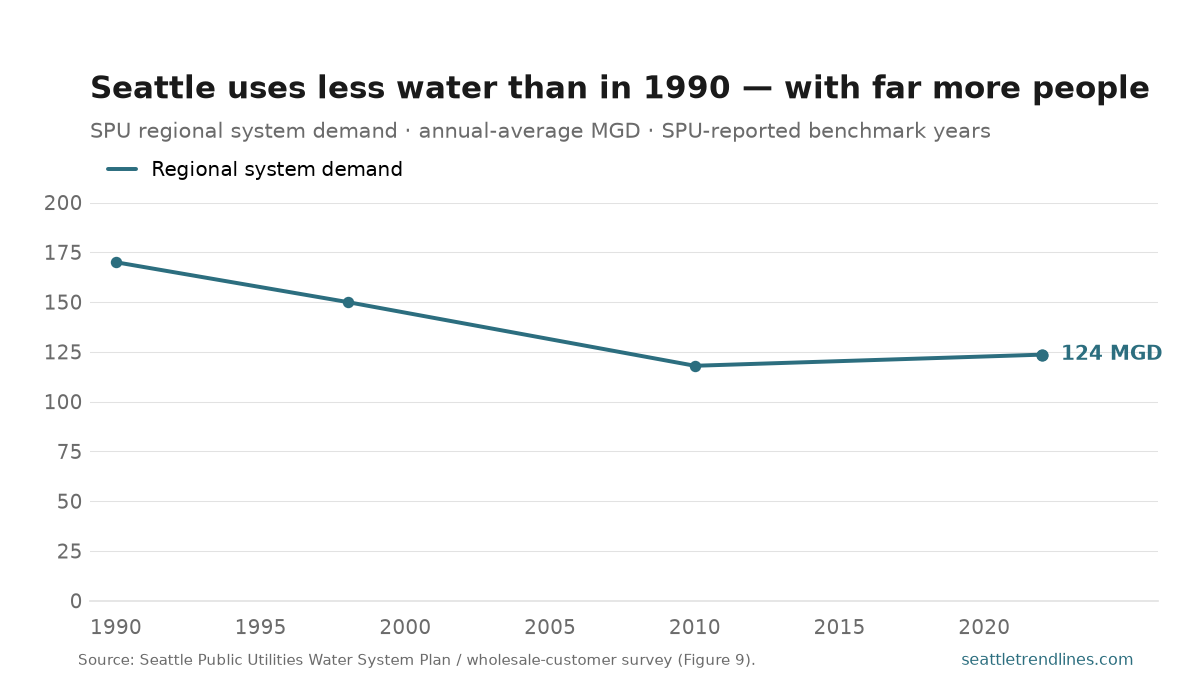
Most infrastructure stories in a growing city are about more: more housing, more transit, more power. Water is the exception. The Seattle regional system — the Cedar and Tolt supply that Seattle Public Utilities runs for about 1.5 million people across the metro — delivered roughly 170 million gallons a day in 1990. By 2022 it was down to about 124 even as the population it serves grew by around 44%. Total demand fell about 27% while the customer base swelled; per-person use is roughly half what it was in 1990. SPU’s own framing: the region now uses less water in total than it did in 1957.
The decline wasn’t gradual erosion so much as a step change that stuck. Demand sat on a plateau near 170 through the late 1980s, then the 1992 drought forced mandatory curtailment and broke the habit. What kept it broken was structural: the 1993 plumbing code (low-flow toilets, showerheads, and faucet aerators), progressively efficient appliances, a sustained regional conservation program, rising water rates that made waste expensive, and tighter system operations that cut leakage and reservoir overflow. Demand bottomed near 118 in 2010 and has drifted up only slightly since — into the low 120s — as population growth finally began to outrun the efficiency gains.
Why it matters beyond the utility bill: a region that added nearly half again as many people while cutting total water use has effectively manufactured new supply out of conservation, deferring the cost of new dams or bigger withdrawals — and leaving more water in the rivers, which is its own kind of dividend for the salmon. One honesty note on the chart: SPU publishes the full annual series only as a graphic, so the points plotted here are its reported figures at benchmark years, not a continuous meter read — the shape is right, the exact path between dots is SPU’s, not mine.
Source: Seattle Public Utilities — Water System Plan and annual wholesale-customer survey (Figure 9, Population & Components of Water Demand). Annual-average demand on the SPU regional supply system. SPU reports the full series only as a chart; values shown are its stated benchmark figures. Annual.
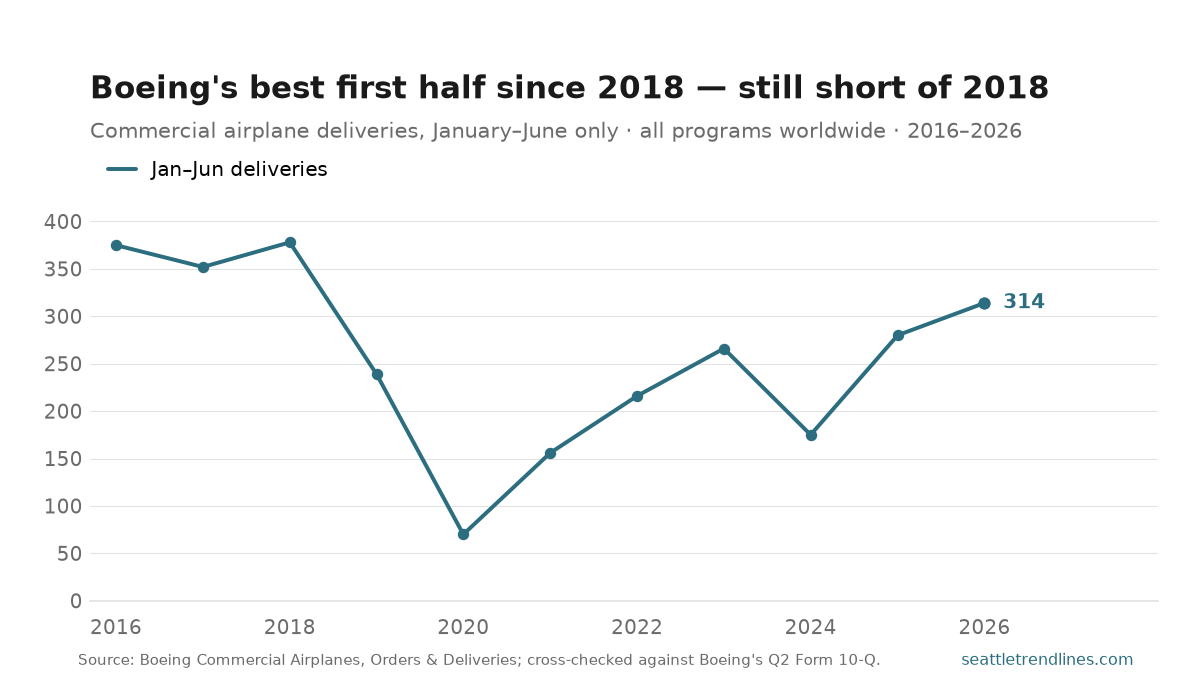
Boeing is still the Puget Sound’s largest manufacturing employer, and its monthly delivery count is the cleanest read on how busy the region’s assembly lines are. In June 2026 the company delivered 64 commercial airplanes: 50 737 MAX jets, 10 787-9 Dreamliners, three 767s, and one 777 Freighter.
Of those 64, 54 were assembled in Washington — the 737 in Renton, the 767 and 777 in Everett. The ten 787s are built in North Charleston, South Carolina, the one widebody line Boeing moved out of the region. So June’s tally is really 54 Puget Sound airplanes plus ten from the Carolinas.
June brought Boeing’s second-quarter total to 171 jets and its first-half total to 314 — up 12% from the first half of 2025 and the company’s best first half since 2018, as 737 MAX output keeps climbing back from the strike- and quality-related slowdowns of 2024. The order book stayed deep: 121 gross orders in June, 445 gross (386 net) for the half, and a backlog of 6,202 aircraft at month-end — years of work for the region’s aerospace payrolls.
The chart is why “best first half since 2018” is both true and a smaller claim than it sounds. Boeing’s January–June count collapsed twice inside six years: to 239 in 2019, when the 737 MAX was grounded that March, and to 70 in the first half of 2020, when the airlines stopped taking airplanes at all. The climb back has been anything but a straight line — 156, then 216, then 266 in 2023, then a slide to 175 in the first half of 2024 after the January door-plug blowout put a regulator’s cap on MAX output. Two strong halves have followed. But the pre-grounding plateau was 375, 352 and 378 in 2016, 2017 and 2018. At 314, Boeing is still running about 17% below its 2018 pace. This is a recovery, not a return.
One caveat on reading the chart as a Puget Sound indicator: it counts every Boeing commercial delivery worldwide, the North Charleston 787s included, because that is the only basis on which the company reports the number consistently. The first-half 314 breaks down as 243 737s, 40 787s, 16 767s and 15 777s, so 274 of the 314 — 87% — were assembled in Washington, a slightly higher local share than June’s 54-of-64 (84%). The line’s shape — grounding, pandemic, door plug, recovery — is the Renton and Everett story. Its level runs about 15% above the region’s own count.
Source: Boeing Commercial, Orders & Deliveries (monthly, company IR). June 2026 program detail via Air Data News; first-half context via CNBC. Chart series: January–June deliveries by year, hand-pulled from Boeing’s monthly O&D summaries and cross-checked against the six-month delivery tables in Boeing’s Q2 Form 10-Q filings (data/boeing-h1-deliveries.csv carries the per-year citation). Final-assembly locations: 737 (Renton, WA), 767 and 777 (Everett, WA), 787 (North Charleston, SC). Boeing reports July deliveries in mid-August.
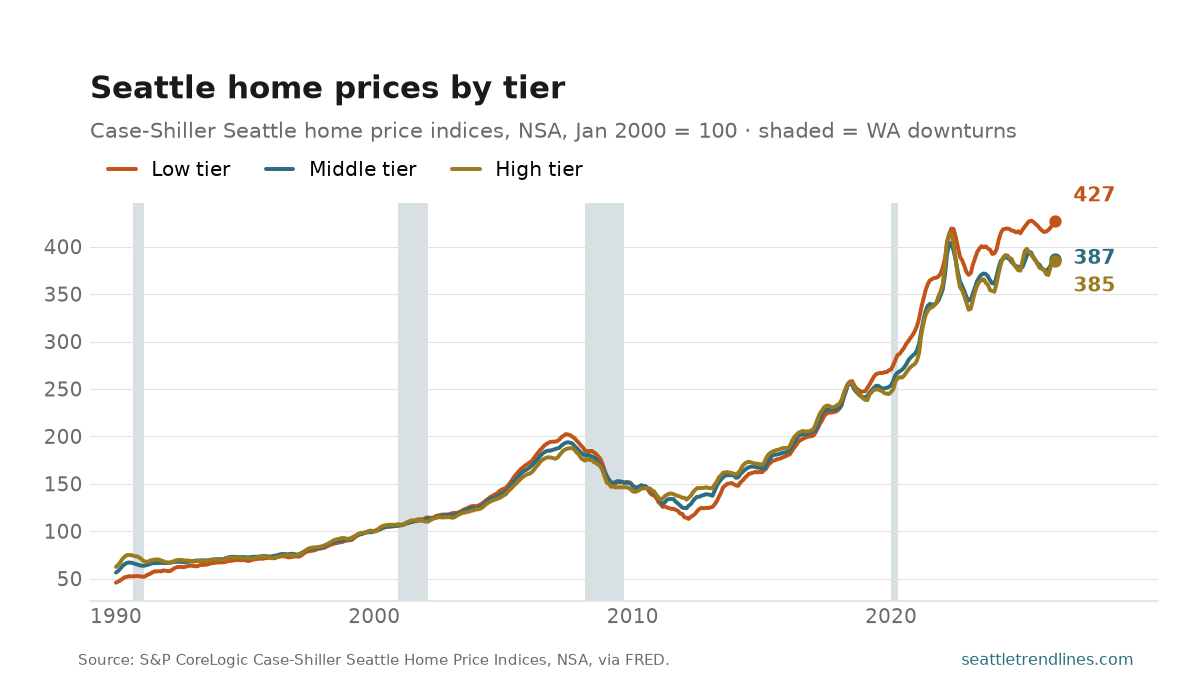
The Case-Shiller Seattle home price index read 393.2 in June 2026 — down 1.9% from a year earlier, and 3.9× its January 2000 level. The three tiers are the part worth watching: S&P splits the metro’s repeat sales into thirds by price, and the cheapest third has pulled steadily away from the most expensive third since 2012. Case-Shiller is a three-month average reported with a two-month lag, so it is the slowest of the local price measures — and the most methodologically careful.
Source: S&P CoreLogic Case-Shiller Seattle Home Price Indices, not seasonally adjusted, via FRED (SEXRNSA, tiers SEXRLTNSA / SEXRMTNSA / SEXRHTNSA). January 2000 = 100. Auto-generated each build.
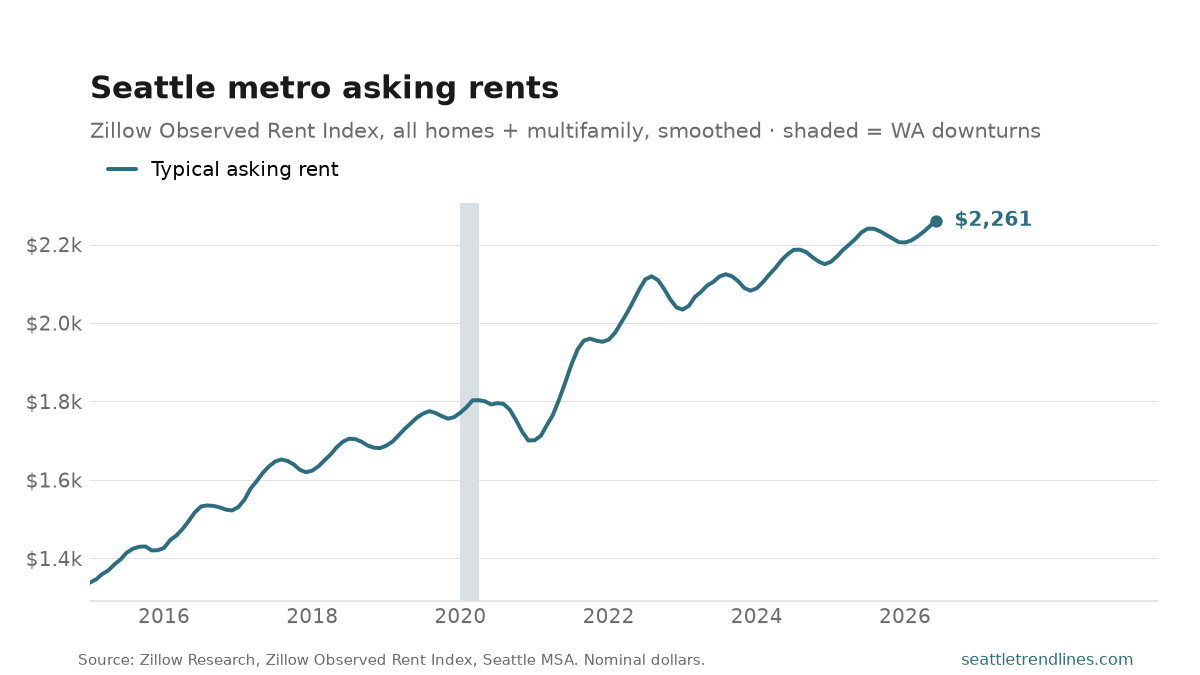
The typical asking rent in the Seattle metro was $2,261 a month in June 2026, up 1.3% from a year earlier. ZORI tracks new leases, not the average rent paid across all tenants, so it turns roughly a year before the rent component of the local CPI does — which makes it the leading indicator of the two. Nominal dollars.
Source: Zillow Research, Zillow Observed Rent Index (ZORI), Seattle–Tacoma–Bellevue MSA, smoothed, all homes plus multifamily, nominal dollars. Auto-generated each build.
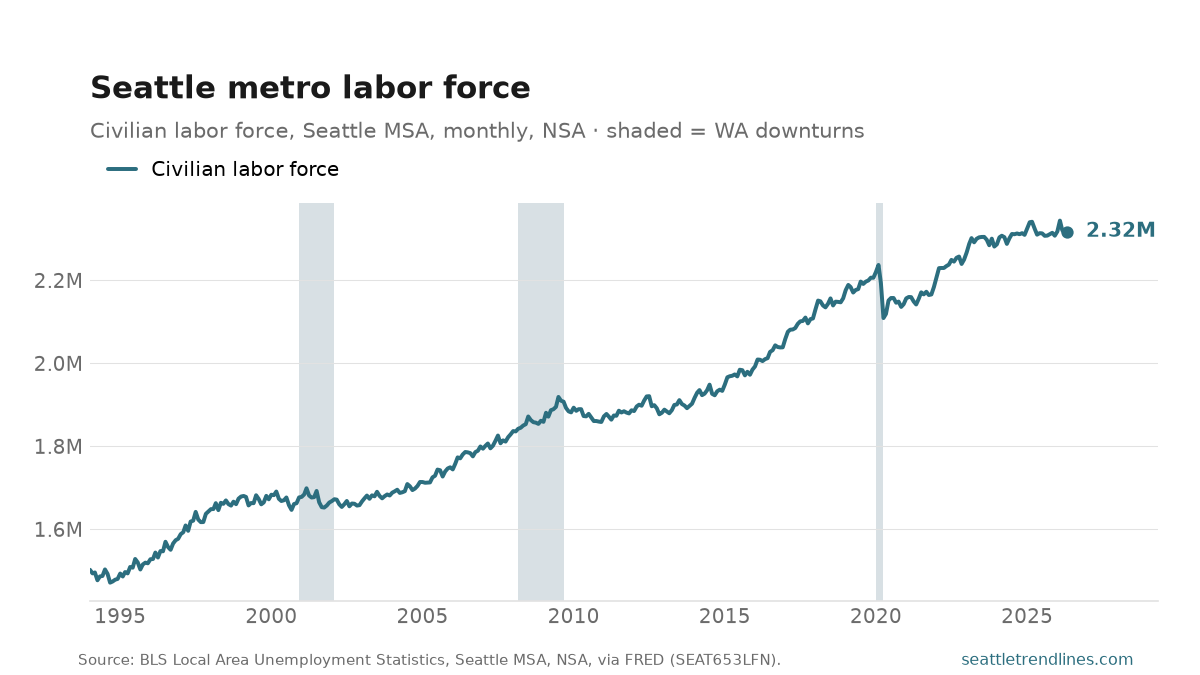
The Seattle–Tacoma–Bellevue labor force — everyone employed or actively looking for work — was 2,317,646 in May 2026, up 0.3% from a year earlier. It’s the head-count denominator under the unemployment rate: a labor force that grows with population and participation. Not seasonally adjusted.
Source: U.S. Bureau of Labor Statistics, Local Area Unemployment Statistics, Seattle–Tacoma–Bellevue MSA civilian labor force, not seasonally adjusted, via FRED SEAT653LFN. Auto-generated each build.
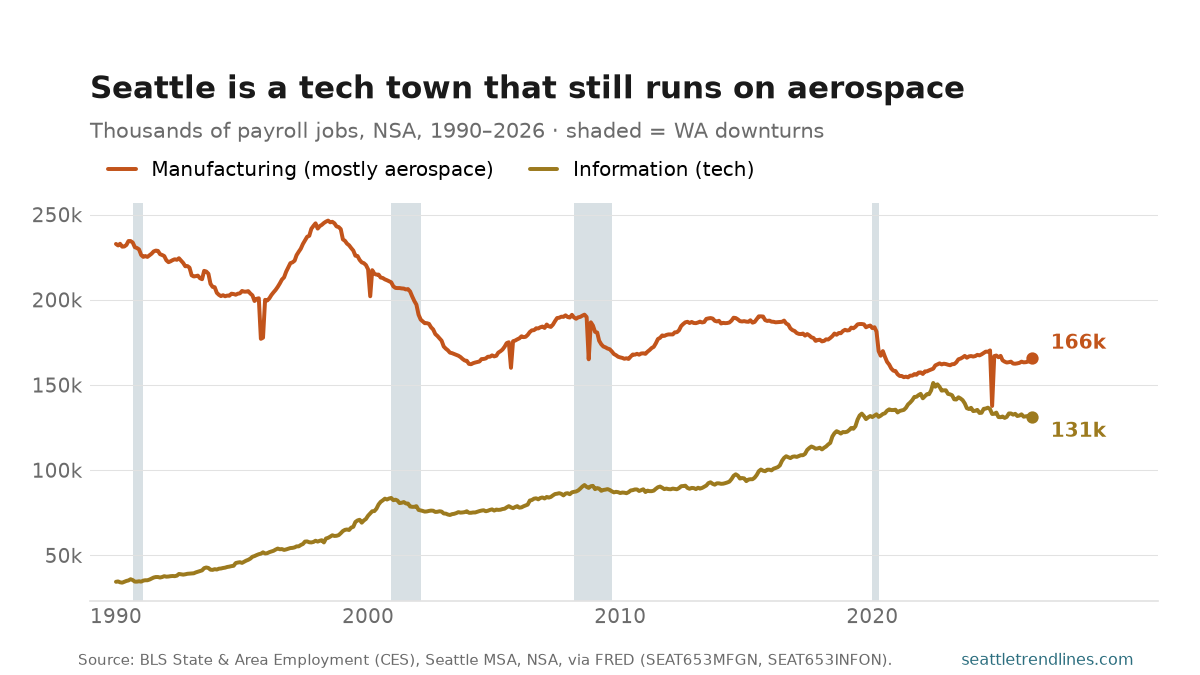
Seattle sells itself as a tech town — Amazon, Microsoft, a cloud on every résumé. But payrolls tell a stubborner story. In May 2026 the Information sector — software, publishing, telecom, the closest thing the official data has to “tech” — employed 131,200 people across the metro. Manufacturing, which here is overwhelmingly Boeing and its aerospace supply chain, employed 165,800. Aerospace still out-hires tech by about 35,000 jobs, and despite thirty-six years of Seattle becoming synonymous with software, these two lines have never crossed.
They have, however, spent a generation closing. In 1990 it wasn’t close: manufacturing employed 232,800 and Information just 34,500 — a gap of nearly 200,000. Information then climbed almost without interruption for three decades, the Microsoft-then-Amazon ascent, peaking near 151,200 in June 2022. Since then it has fallen for three straight years to 131,200, off about 13% from that peak — the local fingerprint of the 2023–2025 tech retrenchment. Manufacturing ran the opposite way: down about a third from its 246,500 high in 1998, with the violent single-month notches — 1995, 2005, 2008, and again in October 2024 — marking Boeing machinist strikes, visible because the series isn’t seasonally adjusted. The 2024 strike alone dropped the line to 137,700 before it snapped back.
The right edge is the surprise. Over the past year the town’s identity and its payroll data point in opposite directions: tech was flat (Information −0.1% year over year) while aerospace grew (manufacturing +1.6%), lifting the sector off its strike-year floor. So the convergence that looked inevitable for thirty years has stalled — not because tech overtook aerospace, but because aerospace stopped falling and tech stopped rising. Whether the crossover ever happens now depends less on Amazon than on Boeing’s order book.
One caveat on the labels. There is no clean monthly “aerospace” series for the metro, so this uses total manufacturing as the stand-in; in the Seattle MSA that is a fair proxy — aerospace dominates the sector — but it also sweeps in a tail of food, shipbuilding, and other production. “Information” likewise undercounts tech, since plenty of software work is booked under professional services. The levels are proxies; the shapes — one sector cresting and rolling over, the other grinding down and flattening — are the real story. For the fuller sector picture, see the jobs-by-sector breakdown.
Source: U.S. Bureau of Labor Statistics, State & Area Employment (CES), Seattle–Tacoma–Bellevue WA MSA, not seasonally adjusted, via FRED — Manufacturing and Information. Thousands of jobs, dated to the first of the month. New months post about three weeks after month-end; this chart refreshes on the next daily build.