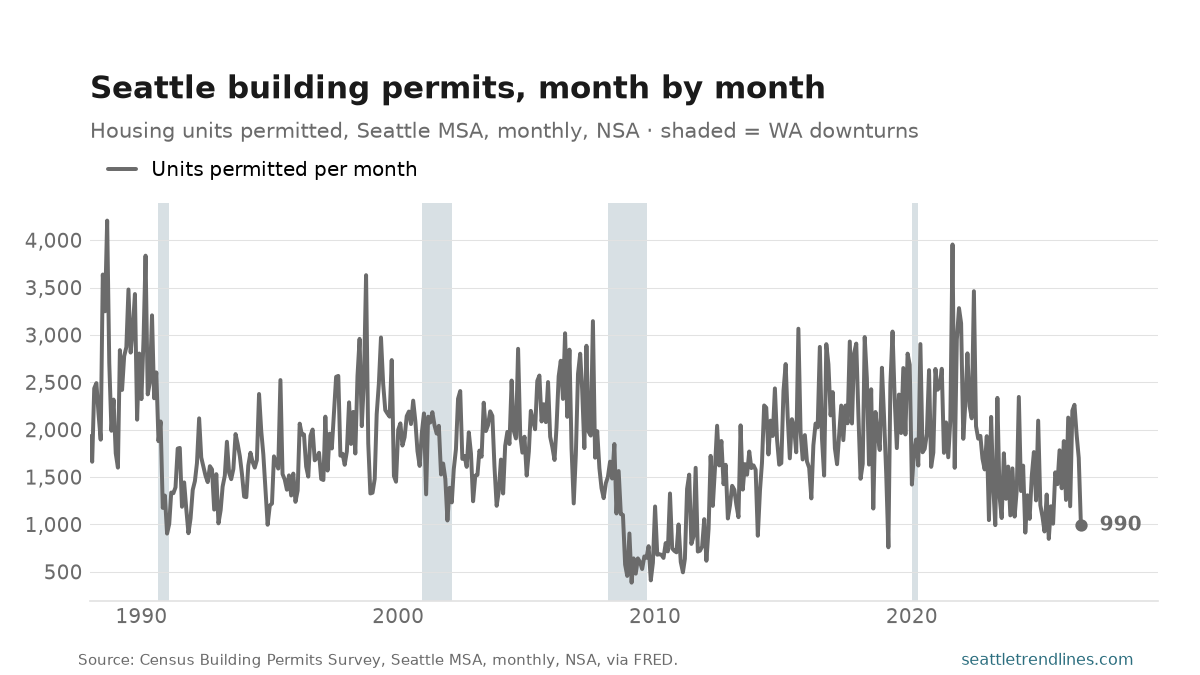
The Seattle metro permitted 990 housing units in August 2026. Against the trailing twelve months — 20,152 units — that single month is worth roughly 5% of a year.
This is the raw monthly series, and it is here to show how little a single month is worth. One large apartment building can be several hundred units filed on one day, so the line swings between 386 and 4207 without the construction industry doing anything unusual. Every ‘permits plunge’ story is built on a chart like this one.
The twelve-month sum is the series to read for the trend, and it is the one this site leads with. Keep both: the smoothed line says what is happening, this one says how much to trust any single reading of it.
Source: U.S. Census Bureau Building Permits Survey, Seattle–Tacoma–Bellevue MSA, monthly, not seasonally adjusted, via FRED. Auto-generated each build.
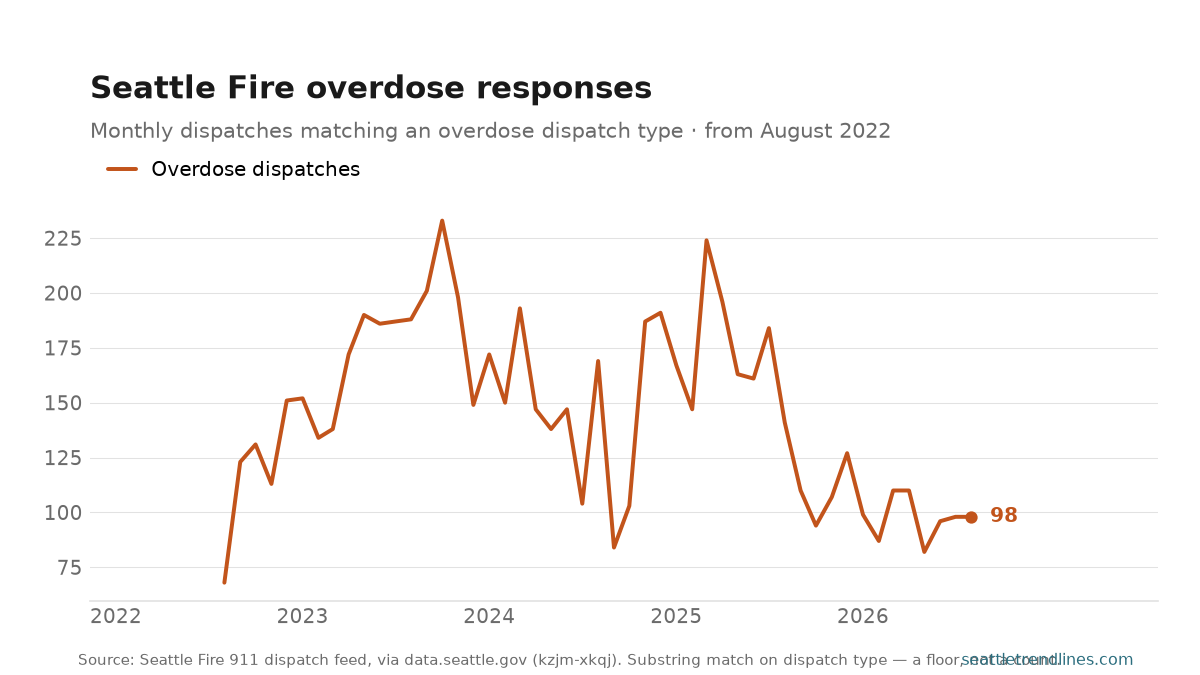
Seattle Fire was dispatched to 98 overdose calls in August 2026, down 30.5% from a year earlier. Across the series the monthly count has run between 68 (August 2022) and 233 (October 2023).
This is a floor, not a count. The dispatch feed carries no overdose flag; the number comes from matching the free-text dispatch type, so a call logged as an aid response or an unconscious person is not in it even when that is what it was. The real figure is higher, by an unknown and probably unstable margin.
The series starts in August 2022 because that is when the dispatch label first appears in the feed. The nineteen years in front of it are the absence of a category, not the absence of overdoses, and they are clipped out of both the chart and the arithmetic above so nothing here reports a record low that is really a missing label. It counts dispatches, not patients or deaths.
Source: Seattle Fire Department, Real-Time 911 dispatch feed, via data.seattle.gov (Socrata kzjm-xkqj), matched on dispatch type. Auto-generated each build.
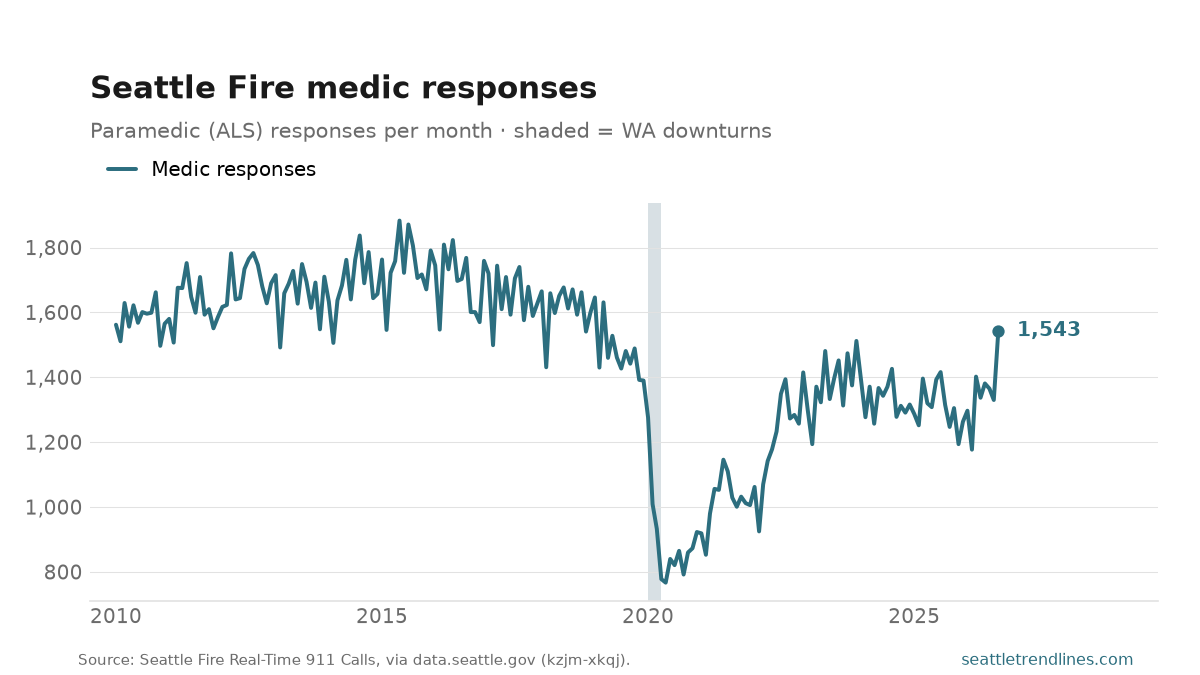
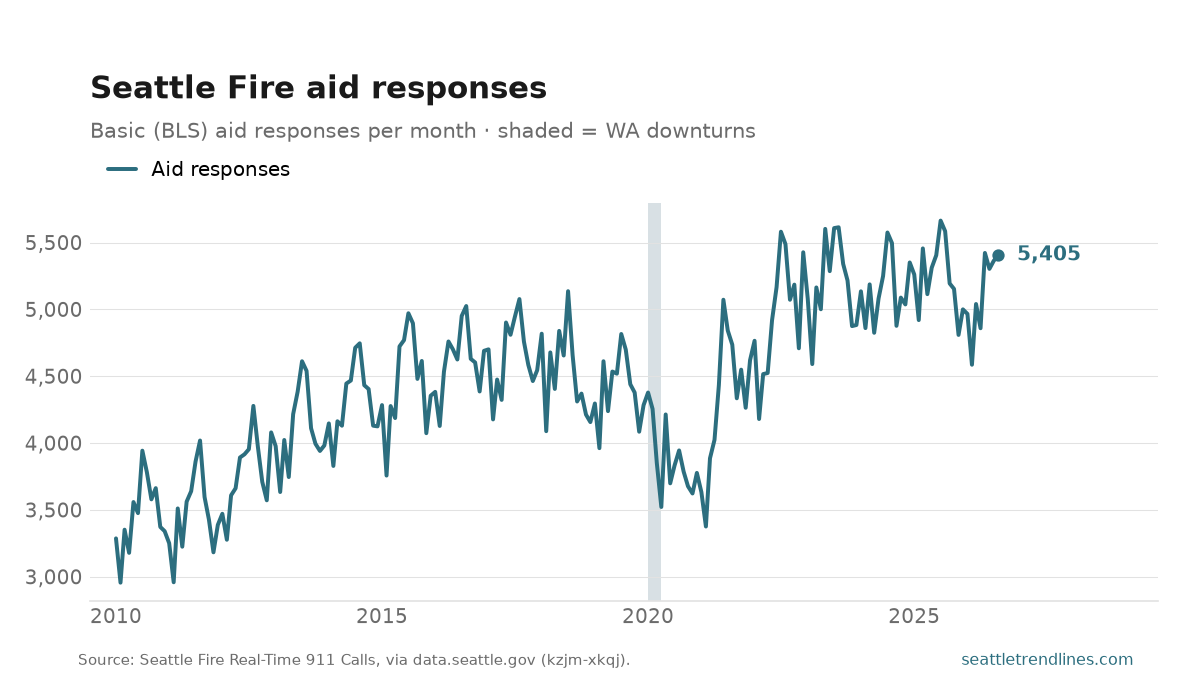
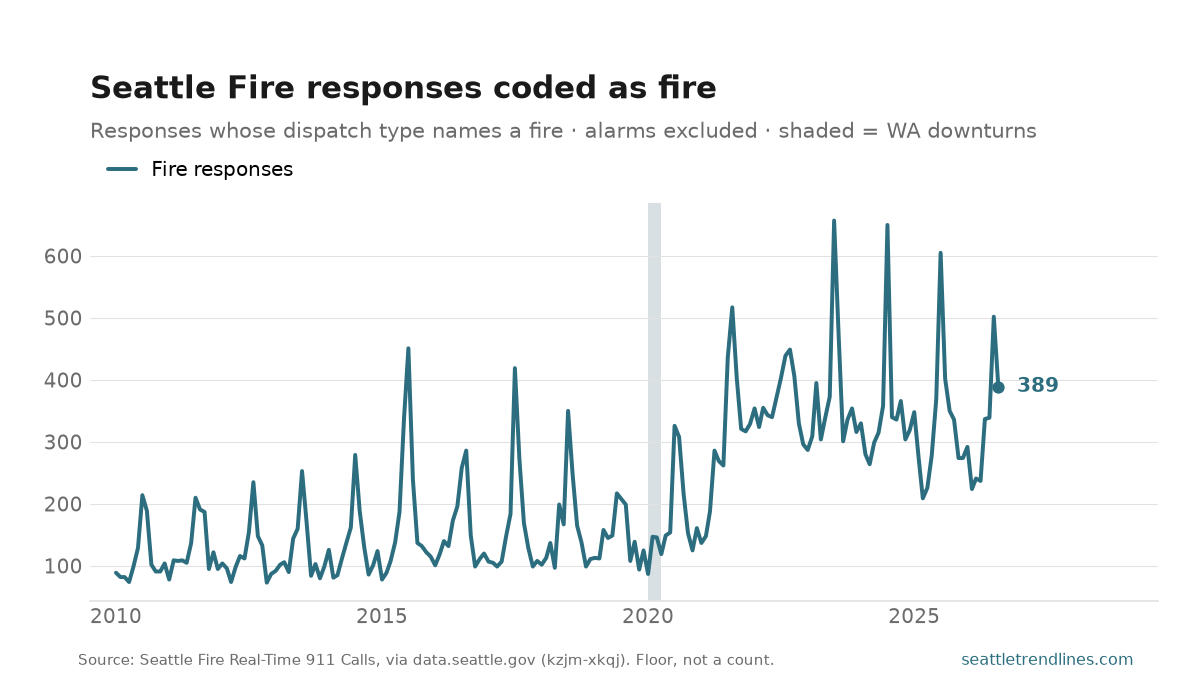
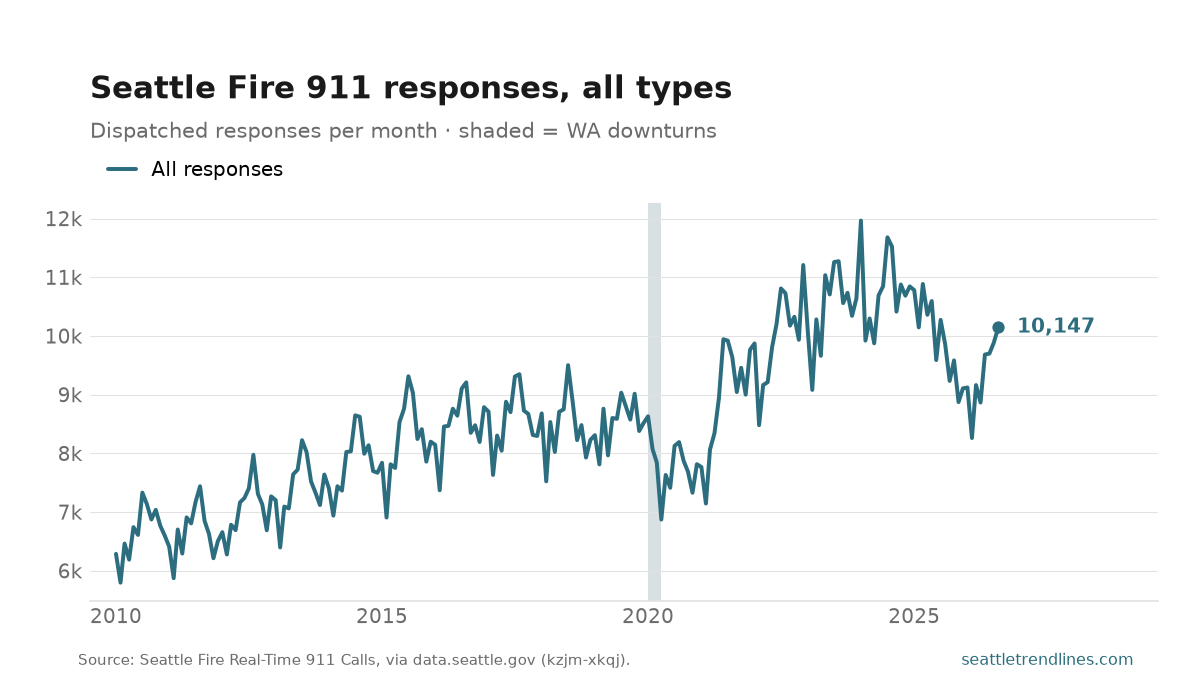
Seattle Fire dispatched 10,147 responses in August 2026, up 2.9% from a year earlier. Despite the name, this is mostly not a fire series, which is why the categories now get their own graphs rather than sharing a pair of axes: medical work is most of the volume and the fire work is small enough that on a shared scale it is a flat line along the bottom.
Medic responses — paramedic-level (ALS) calls, the most serious tier — ran 1,543, up 17.3% year over year. Aid responses — the basic (BLS) tier, and the single largest category — ran 5,405, down 3.2%. Between them that is 6,948 of the month’s total, leaving about 3,199 responses across everything else the department is sent to.
Fires are separable, with a caveat. The feed has no fire flag — only a free-text dispatch type — so the third chart counts responses whose type names a fire (‘Fire in Building’, ‘Brush Fire’, ‘Auto Fire’), with automatic alarms excluded because most of those turn out not to be fires. That makes it a floor on fire work rather than a count of fires: a fire first dispatched as an alarm, or under a label like ‘Illegal Burn’, is not in it.
The sawtooth is real seasonality, plus the calendar. Part of the month-to-month zigzag is just month length — February has 28 days and posts a low count for that reason alone. Per day, over the last decade, July runs about +6% against the surrounding year and April about -4%: the load builds through the summer and falls off in the spring. That is the shape of more people outdoors, more heat, more traffic and more alcohol — it shows up strongest in aid calls and only weakly in medic calls, which is what you would expect if the summer increment is minor injury rather than cardiac arrest. Because the series is not seasonally adjusted, compare a month to the same month a year earlier, never to the one before it.
All of these count dispatched responses, not incidents or patients — one event can draw several units, so the lines move with deployment practice as well as with need.
Source: Seattle Fire Department, Real-Time 911 Calls, via data.seattle.gov (Socrata kzjm-xkqj). Categories are cut from the free-text dispatch type, so they are floors rather than exact counts. Auto-generated each build.
What’s coming on seattletrendlines.com the week of September 28 – October 2 — 11 posts on the calendar.
Monday, September 28 — Seattle Fire 911 responses, August 2026; Seattle Fire overdose responses, August 2026; Building permits, month by month, August 2026.
Tuesday, September 29 — The three parks, August 2026; Seattle tech employment, August 2026.
Wednesday, September 30 — Seattle home prices, June 2026; Checkouts per Seattleite, August 2026.
Thursday, October 1 — Checkouts per Seattleite, August 2026; Seattle-metro other services jobs, August 2026.
Friday, October 2 — Washington jobless claims, week of Sep 19, 2026 (pending — its numbers haven’t landed yet); Seattle home prices, June 2026 (pending — its numbers haven’t landed yet).
This is the plan, not a promise. Every weekday post here is tied to a data release, and a release that slips takes its post with it — the post simply waits for the day its numbers land. A figure that arrives early, a revision worth writing about, or an unexpected story out of Seattle can just as easily add a post that isn’t on this list. Expect the week to look roughly like this, and expect at least one day of it not to.
The week of September 21–25 on seattletrendlines.com, in 12 posts.
Monday, September 21 — King County’s electric fleet, August 2026. King County had 116,264 battery-electric vehicles and 24,431 plug-in hybrids registered in August 2026 — batteries are 83% of the county’s electric fleet. The battery count is up 9.8% from a year earlier.
Monday, September 21 — Electric vehicles on Washington roads, August 2026. 291,146 electric vehicles were registered in Washington in August 2026, up 11.8% from a year earlier. King County holds 140,695 of them — 48% of the state’s fleet, in a county with about a third of its people.
Tuesday, September 22 — What Seattle reports to the city, August 2026. Seattle residents filed 31,472 service requests in August 2026 — potholes, graffiti, illegal dumping, abandoned vehicles, encampments — down 6.1% from a year earlier. 26,992 of them, 86%, came through the Find It, Fix It apps.
Tuesday, September 22 — What a Seattle-area house is worth, August 2026. The typical Seattle-metro home was worth $727,359 in August 2026, down 1.5% from a year earlier. Against the series high of $769,953 in June 2022, that leaves the market 5.5% below its high-water mark.
Tuesday, September 22 — Hospitality’s share of Seattle jobs, August 2026. Leisure and hospitality was 10.0% of Seattle-metro payroll jobs in August 2026 — 214,800 jobs in restaurants, bars, hotels and venues. Read this chart against manufacturing’s, because they are the same story from opposite ends.
Wednesday, September 23 — Seattle wages after inflation, August 2026. Private-sector workers in the Seattle metro averaged $48.08 an hour in August 2026. Adjusted for inflation that is $48.08 in today’s money, up 2.4% from a year earlier.
Wednesday, September 23 — Manufacturing’s share of Seattle jobs, August 2026. Manufacturing was 7.9% of Seattle-metro payroll jobs in August 2026: 168,600 manufacturing jobs against every payroll in the metro. The share peaked at 18.4% in January 1990.
Wednesday, September 23 — Seattle-metro payrolls, August 2026. Seattle–Tacoma–Bellevue employers reported 2,143,900 nonfarm jobs in August 2026 (not seasonally adjusted), up 18,600 — +0.9% — from a year earlier.
Thursday, September 24 — Seattle-metro manufacturing jobs, August 2026. Seattle-metro manufacturers employed 168,600 people in August 2026, up 3.7% from a year earlier. The sector peaked at 246,500 jobs in June 1998 and has shed roughly 32% of that since.
Thursday, September 24 — Washington jobless claims, week of Sep 12, 2026. Washington workers filed 4,767 initial unemployment claims in the week ending Sep 12, 2026; the steadier four-week average is 4,735, down 8.0% from a year ago.
Friday, September 25 — Seattle-metro construction jobs, August 2026. The Seattle metro’s construction and mining employers had 124,000 jobs on payroll in August 2026, down 0.2% from a year earlier.
Friday, September 25 — Restaurant and hotel jobs, August 2026. Seattle-metro restaurants, bars, hotels and venues employed 214,800 people in August 2026, up 1.9% from a year earlier. No other series on this site records 2020 as plainly.
The week in review: every post from September 21–25, summarised from its own listing blurb and linked. Assembled each Saturday from the posts that actually published that week.
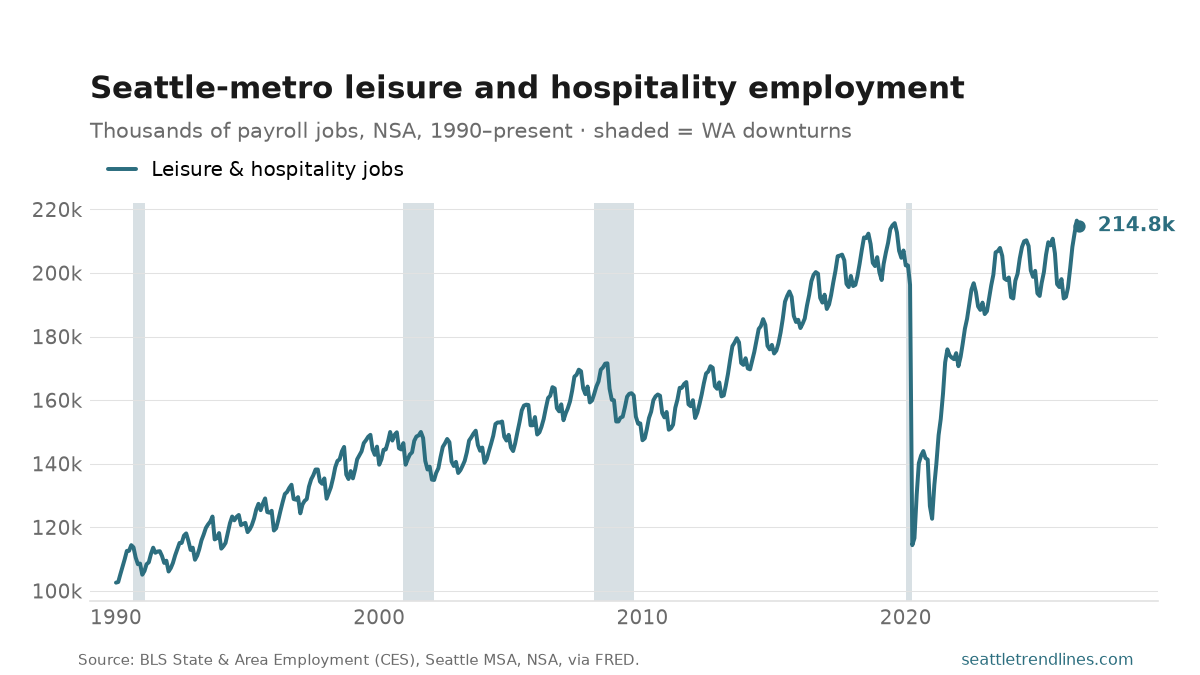
Seattle-metro restaurants, bars, hotels and venues employed 214,800 people in August 2026, up 1.9% from a year earlier.
No other series on this site records 2020 as plainly. Employment in this sector fell to 102,600 in January 1990 — a drop of roughly half, inside two months, in an industry that cannot be done from home. Everything to the right of that notch is the recovery, and how close it has come to the old trend line is the question the chart is for.
It is also the sector where a job is least likely to pay the rent, which is why it is worth watching next to what the rent takes. Not seasonally adjusted, and summer is genuinely the busy season here.
Source: U.S. Bureau of Labor Statistics, State & Area Employment, leisure and hospitality, Seattle–Tacoma–Bellevue MSA, not seasonally adjusted, via FRED. Auto-generated each build.
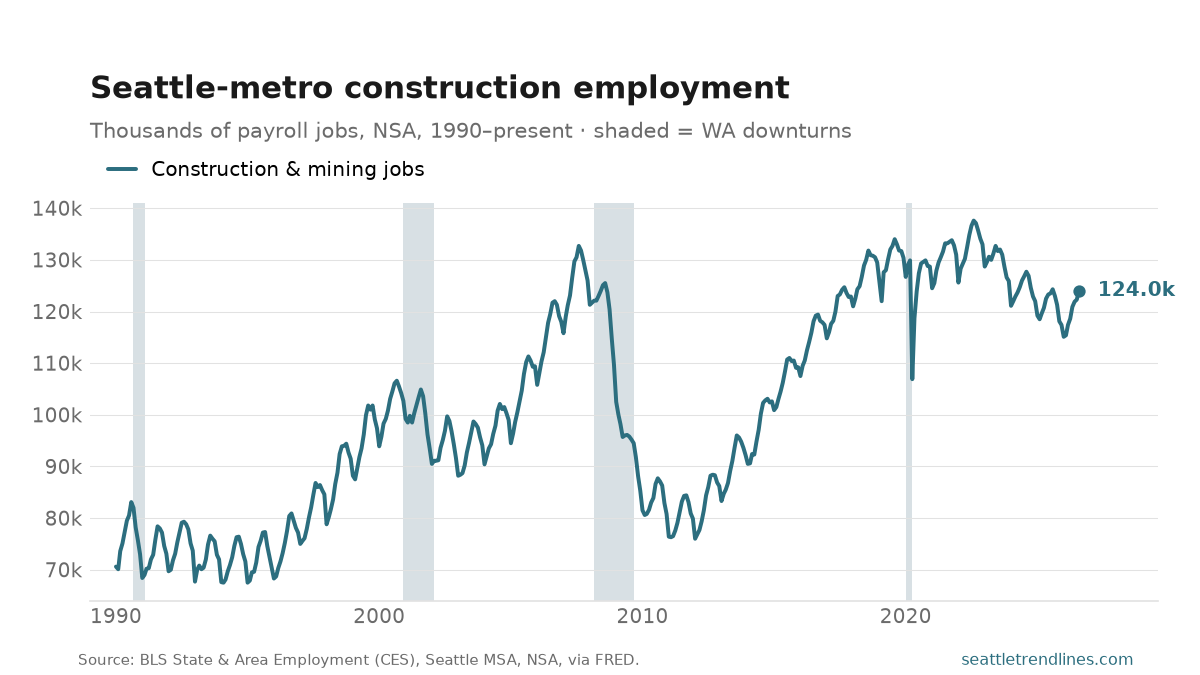
The Seattle metro’s construction and mining employers had 124,000 jobs on payroll in August 2026, down 0.2% from a year earlier.
Construction is the most cyclical sector the site tracks and the one that turns first: the crash after 2007 took roughly a third of these jobs out before the wider downturn had properly arrived. It also has a real summer season in the raw data, so — as everywhere in these NSA series — the year-over-year change is the number that means something and a fall from August to January is just weather.
It sits alongside building permits as this site’s two reads on whether Seattle is building. Permits lead; payrolls are what actually happened.
Source: U.S. Bureau of Labor Statistics, State & Area Employment, mining, logging and construction, Seattle–Tacoma–Bellevue MSA, not seasonally adjusted, via FRED. Auto-generated each build.
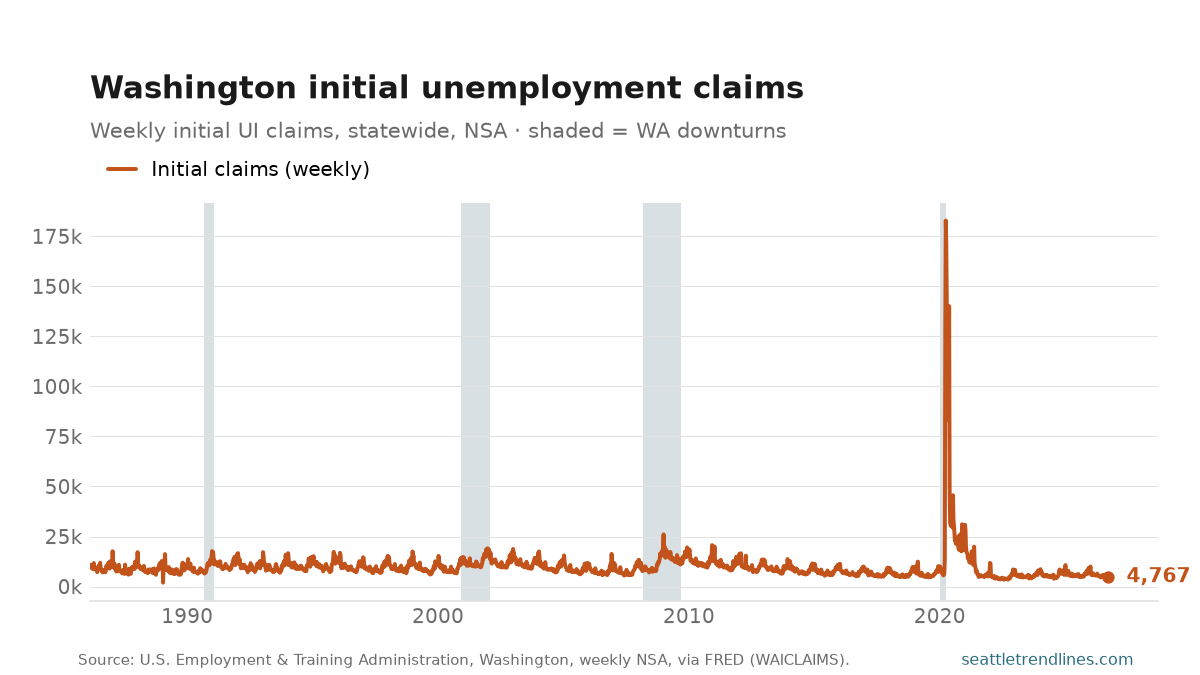
Washington workers filed 4,767 initial unemployment claims in the week ending Sep 12, 2026; the steadier four-week average is 4,735, down 8.0% from a year ago. Statewide, weekly, not seasonally adjusted — the update to the jobless-claims post.
Source: U.S. Employment and Training Administration, initial unemployment-insurance claims for Washington, weekly, not seasonally adjusted, via FRED WAICLAIMS. Auto-generated each build.
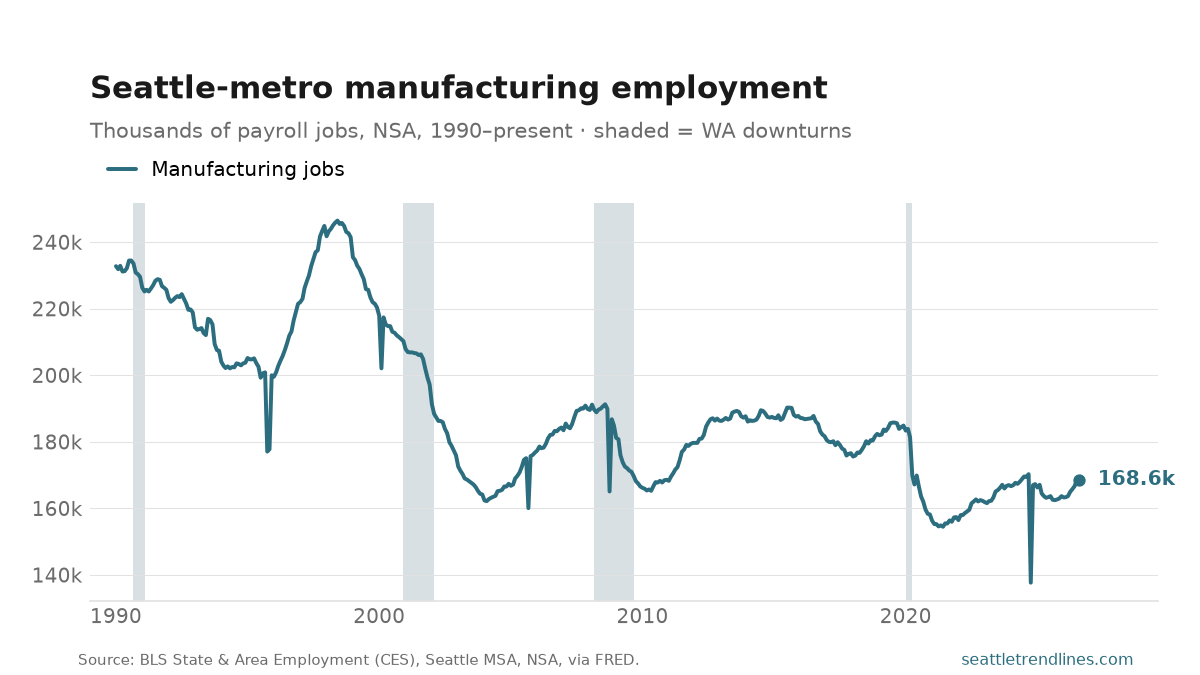
Seattle-metro manufacturers employed 168,600 people in August 2026, up 3.7% from a year earlier. The sector peaked at 246,500 jobs in June 1998 and has shed roughly 32% of that since.
In this region manufacturing is very close to a Boeing series with a rounding error attached, which is why the deep single-month notches line up with machinist strikes rather than with recessions — the data is not seasonally adjusted, so a walkout shows up whole. Reading them as anything else is the standard mistake with this chart.
The sector’s shrinking share of total payrolls is the same story told against the size of the economy, and it is the more damning version.
Source: U.S. Bureau of Labor Statistics, State & Area Employment, manufacturing, Seattle–Tacoma–Bellevue MSA, not seasonally adjusted, via FRED. Auto-generated each build.
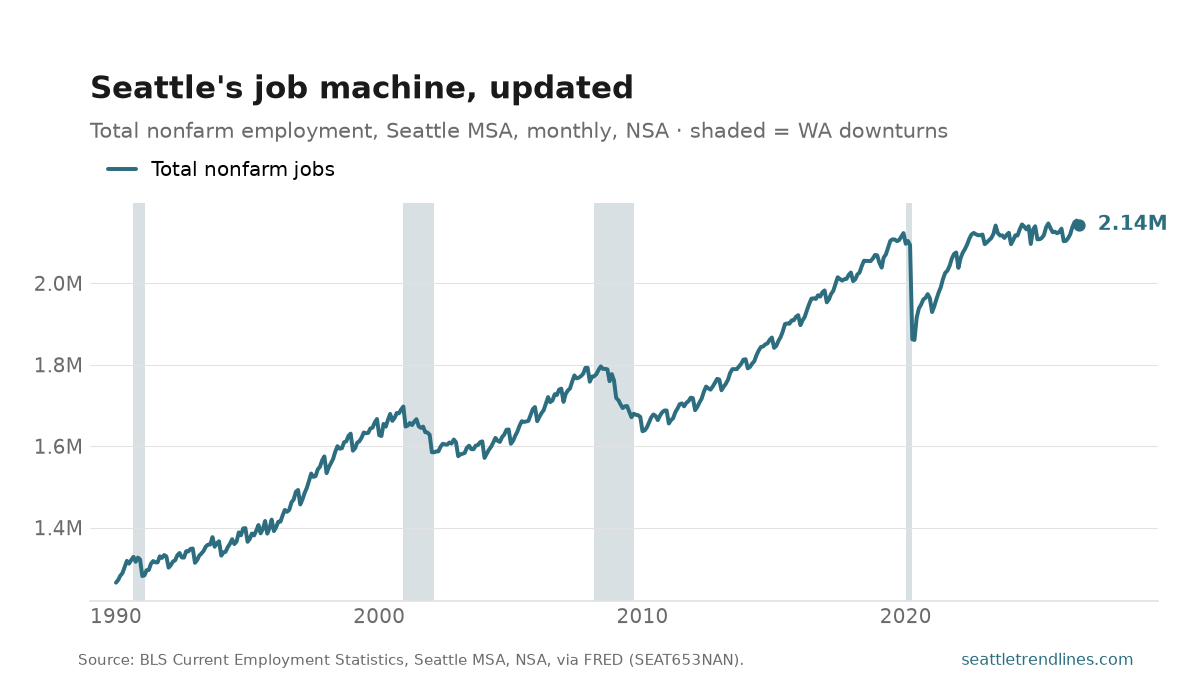
Seattle–Tacoma–Bellevue employers reported 2,143,900 nonfarm jobs in August 2026 (not seasonally adjusted), up 18,600 — +0.9% — from a year earlier. This is the monthly refresh of the stalled job machine; because the series isn’t seasonally adjusted, the year-over-year change is the one to watch.
Source: U.S. Bureau of Labor Statistics, Current Employment Statistics, Seattle–Tacoma–Bellevue MSA, not seasonally adjusted, via FRED SEAT653NAN. Auto-generated each build from the latest observation.