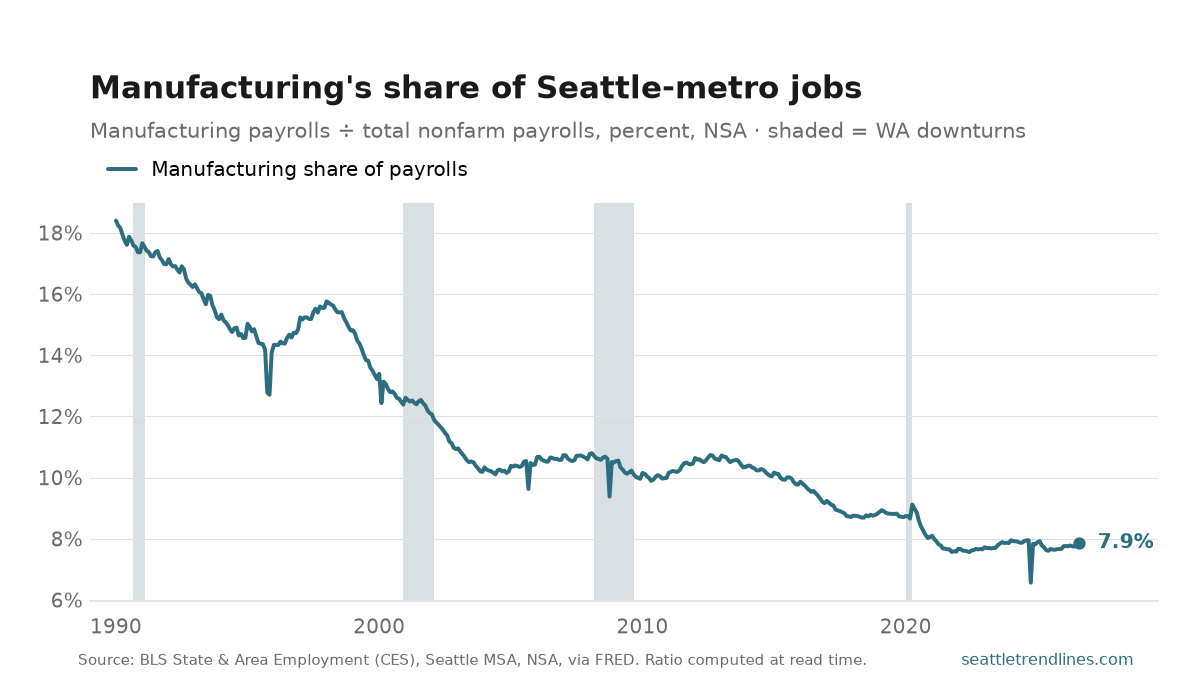
Manufacturing was 7.9% of Seattle-metro payroll jobs in August 2026: 168,600 manufacturing jobs against every payroll in the metro. The share peaked at 18.4% in January 1990.
The share falls faster than the job count does, and the difference between the two charts is the point of this one. Manufacturing employment has declined; the rest of the metro’s economy has grown. Both together are why a sector that once shaped the region’s politics now moves its headline employment number hardly at all.
Numerator and denominator come from the same BLS release for the same metro, so the share stays internally consistent even in a month the levels are revised — this is a ratio computed at read time from two stored series, never a stored series of its own.
Source: U.S. Bureau of Labor Statistics, State & Area Employment, manufacturing and total nonfarm payrolls, Seattle–Tacoma–Bellevue MSA, not seasonally adjusted, via FRED. The share is derived at read time from the two stored series. Auto-generated each build.
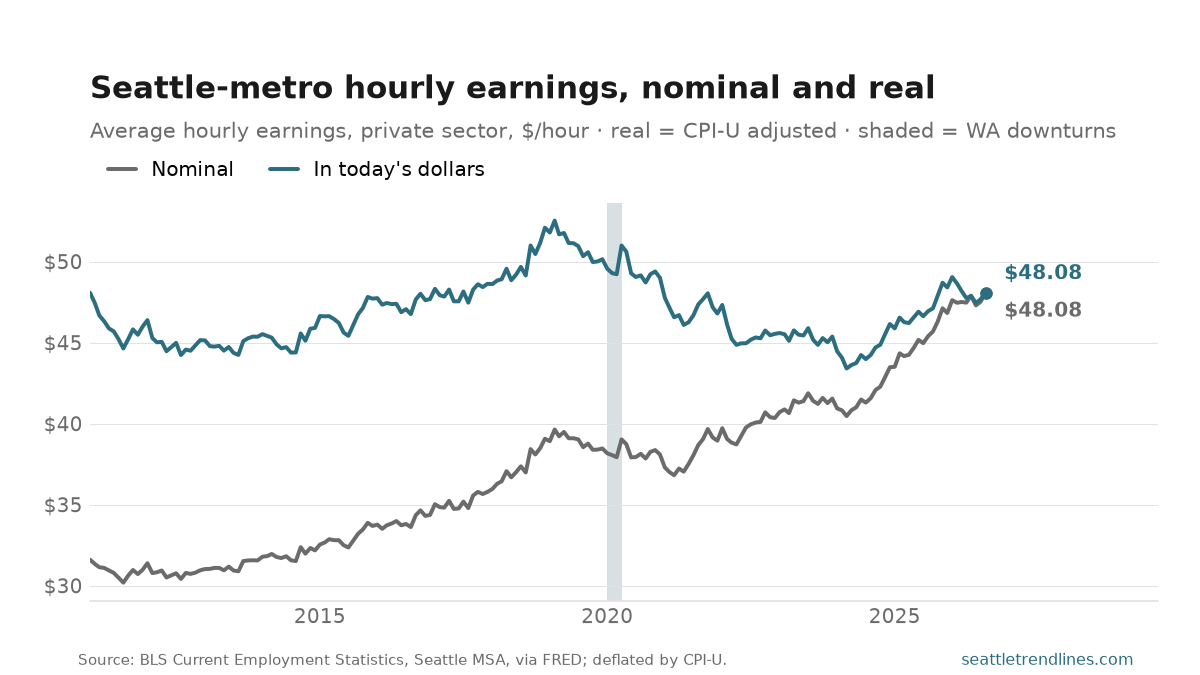
Private-sector workers in the Seattle metro averaged $48.08 an hour in August 2026. Adjusted for inflation that is $48.08 in today’s money, up 2.4% from a year earlier.
The two lines are the post. Nominal pay in this region has gone up almost every month for fifteen years, which is the number that gets announced; whether it bought more is a different question, and between 2021 and 2023 the answer was no. The real series peaked at $52.53 in February 2019.
An average, not a median, so it is pulled upward by high earners — this is a metro where that matters more than most. It also moves with who is working: a month that sheds low-wage jobs raises the average without raising anyone’s pay, which is much of what happened in 2020.
Source: U.S. Bureau of Labor Statistics, Current Employment Statistics, average hourly earnings of all private employees, Seattle–Tacoma–Bellevue MSA, via FRED; real series deflated by CPI-U to the latest available period. Auto-generated each build.
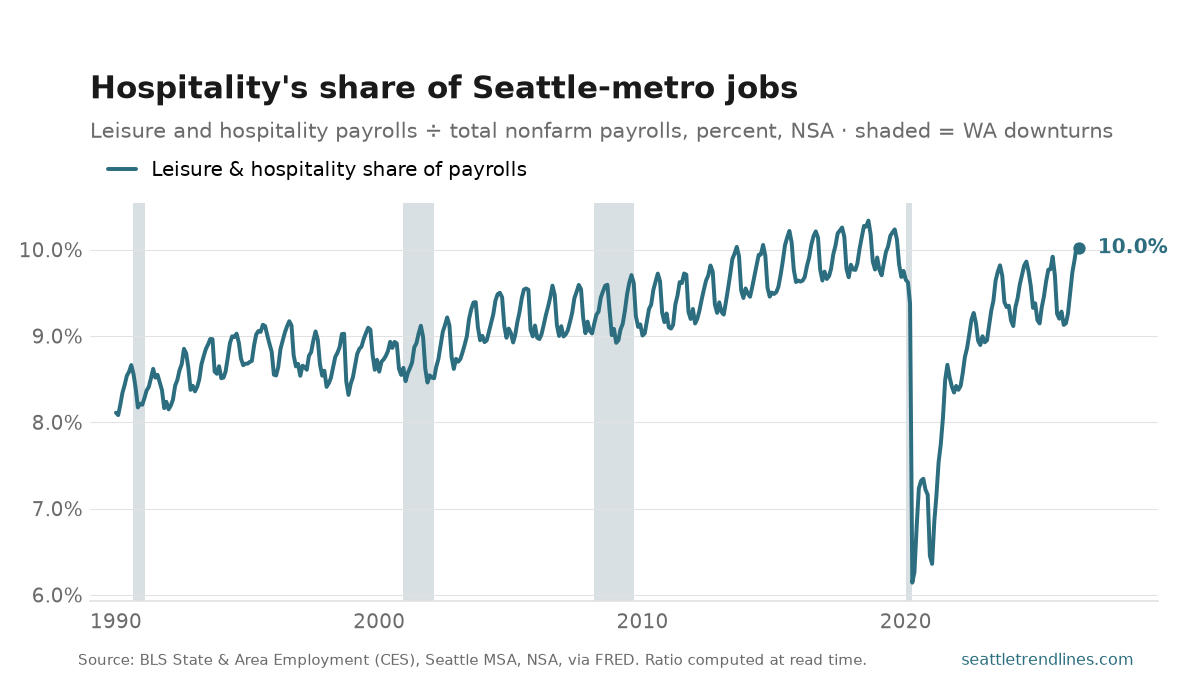
Leisure and hospitality was 10.0% of Seattle-metro payroll jobs in August 2026 — 214,800 jobs in restaurants, bars, hotels and venues.
Read this chart against manufacturing’s, because they are the same story from opposite ends. As the share of the region’s work done in factories fell, the share done serving people rose — from 8.1% when the series opens in January 1990 to a peak of 10.3% in August 2018. That is a real change in what a Seattle job is, and it is not a neutral one: these are the jobs least likely to cover what the rent takes.
The 2020 notch is the sharpest event in any series on this site — the share fell to 6.1% in April 2020, because this is the sector that could not be done from home. Same-release numerator and denominator, computed at read time, not seasonally adjusted.
Source: U.S. Bureau of Labor Statistics, State & Area Employment, leisure and hospitality against total nonfarm payrolls, Seattle–Tacoma–Bellevue MSA, not seasonally adjusted, via FRED. The share is derived at read time. Auto-generated each build.
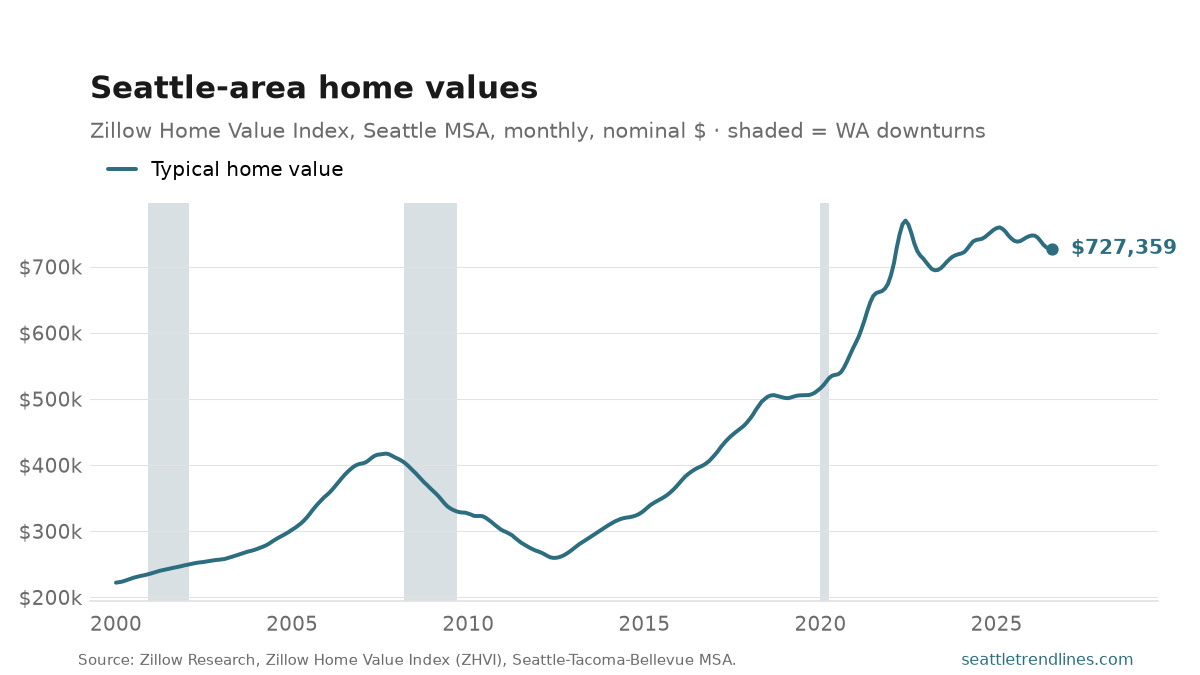
The typical Seattle-metro home was worth $727,359 in August 2026, down 1.5% from a year earlier. Against the series high of $769,953 in June 2022, that leaves the market 5.5% below its high-water mark.
ZHVI measures the value of the typical home rather than the price of the homes that happened to sell, so it does not lurch when an expensive neighbourhood has a busy month — which is exactly what makes it readable month to month, and what makes it a better trend line than asking prices.
Nominal dollars, metro-wide. Zillow revises the back series when its model is updated, so older points can move slightly between builds.
Source: Zillow Research, Zillow Home Value Index (ZHVI), all homes, Seattle–Tacoma–Bellevue MSA, nominal dollars. Auto-generated each build.
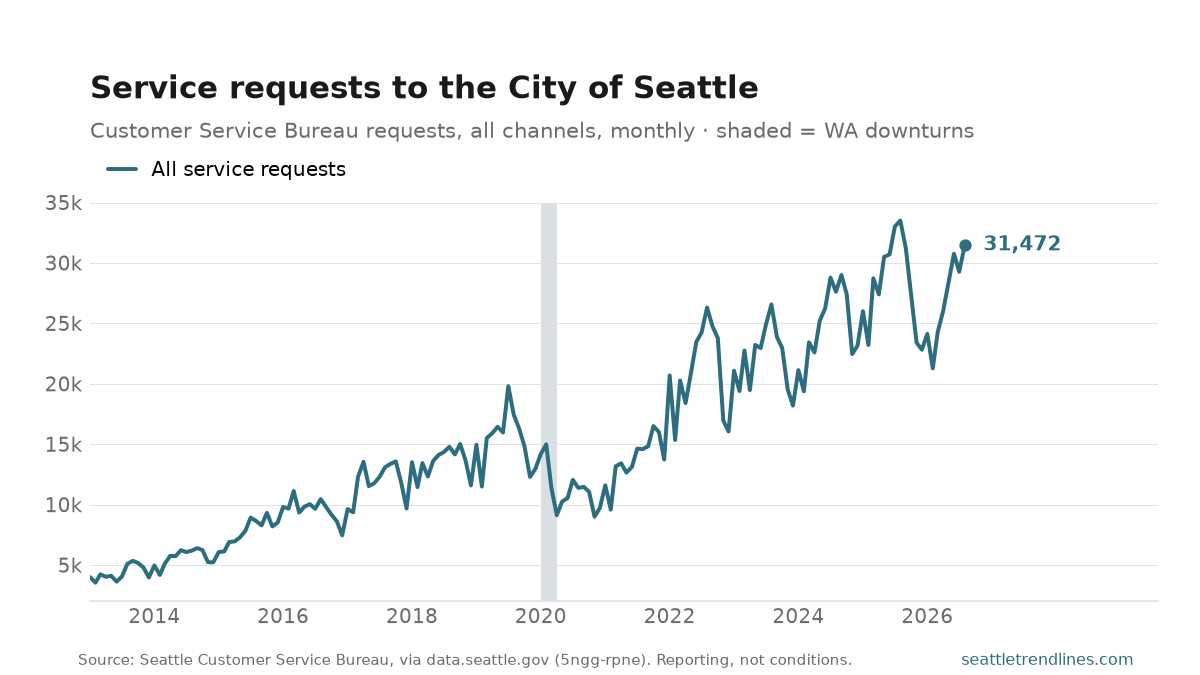
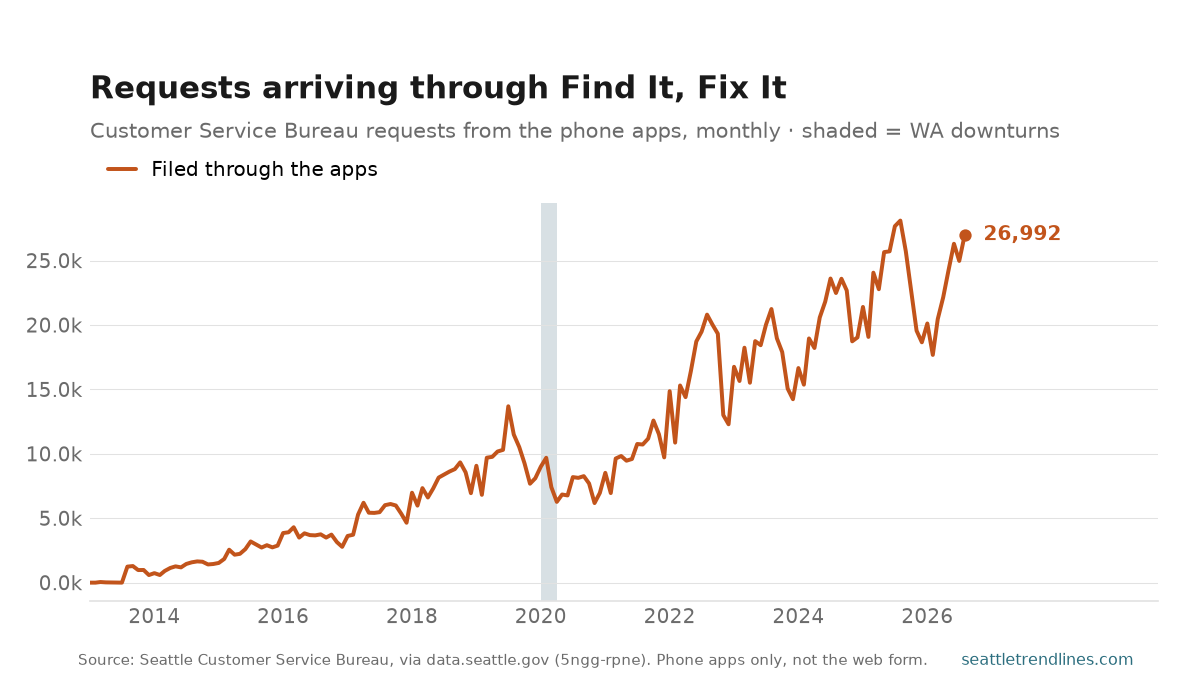
Seattle residents filed 31,472 service requests in August 2026 — potholes, graffiti, illegal dumping, abandoned vehicles, encampments — down 6.1% from a year earlier. 26,992 of them, 86%, came through the Find It, Fix It apps.
This measures reporting, not conditions, and the two come apart. A month with more graffiti reports is a month more people told the city about graffiti, which moves with how easy reporting is at least as much as with how much graffiti there is. The app split beneath the total is the evidence: intake was almost entirely phone calls when this series starts and is overwhelmingly app-based now, and a channel that takes thirty seconds collects complaints a channel that takes ten minutes never heard. Read a rise here as demand for city services being expressed, not as the city getting worse.
The independent check on any of this is a feed nobody chooses to file into — the fire department’s 911 dispatches, which are also on this site. Where the two move together, something real is happening; where only this one moves, the channel changed. Requests are dated by when they were created, and one incident reported by three neighbours is three rows.
Source: Seattle Customer Service Bureau, Customer Service Requests, via data.seattle.gov (Socrata 5ngg-rpne). The app series counts the Find It, Fix It phone apps only, not the browser intake form. Auto-generated each build.
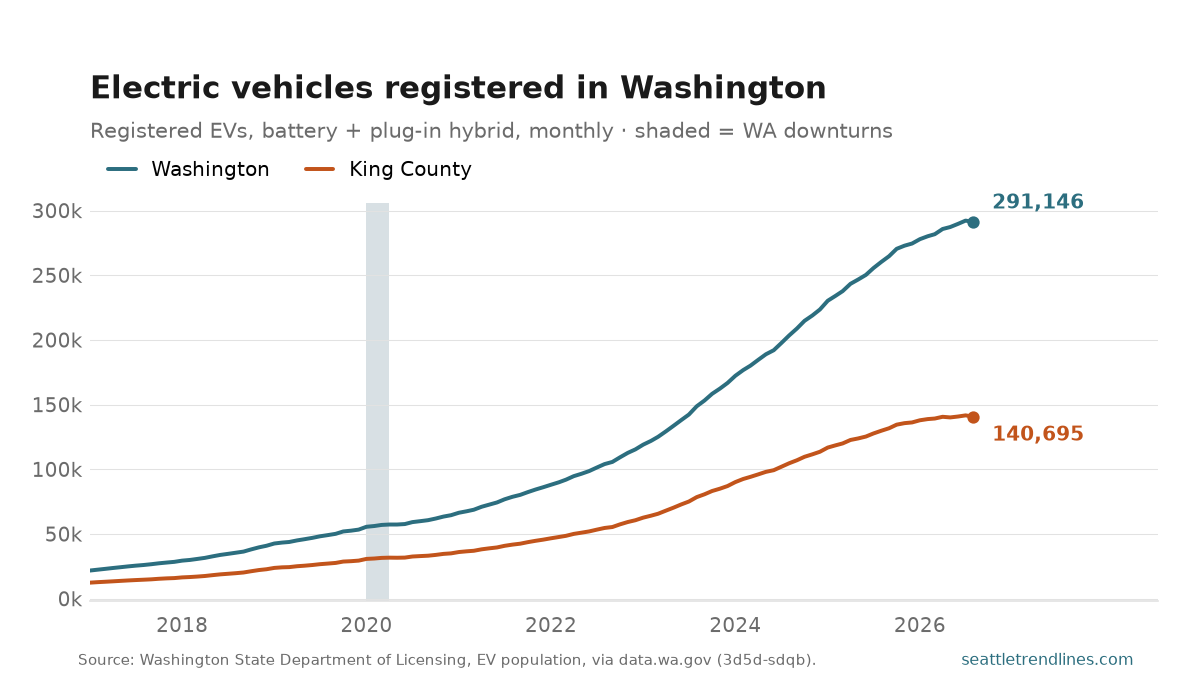
291,146 electric vehicles were registered in Washington in August 2026, up 11.8% from a year earlier. King County holds 140,695 of them — 48% of the state’s fleet, in a county with about a third of its people.
This is a stock, not sales: it counts the EVs registered and on the road in that month, so it falls only when cars leave the fleet faster than they join it. That makes the slope, rather than the level, the thing to read — a flattening line means adoption slowing, not the fleet shrinking.
Battery-electric and plug-in hybrid vehicles are both counted here; the mix between them is its own post, and the two have not grown at the same rate.
Source: Washington State Department of Licensing, Electric Vehicle Population, via data.wa.gov (Socrata 3d5d-sdqb). Counts vehicles registered in the month, not sales. Auto-generated each build.
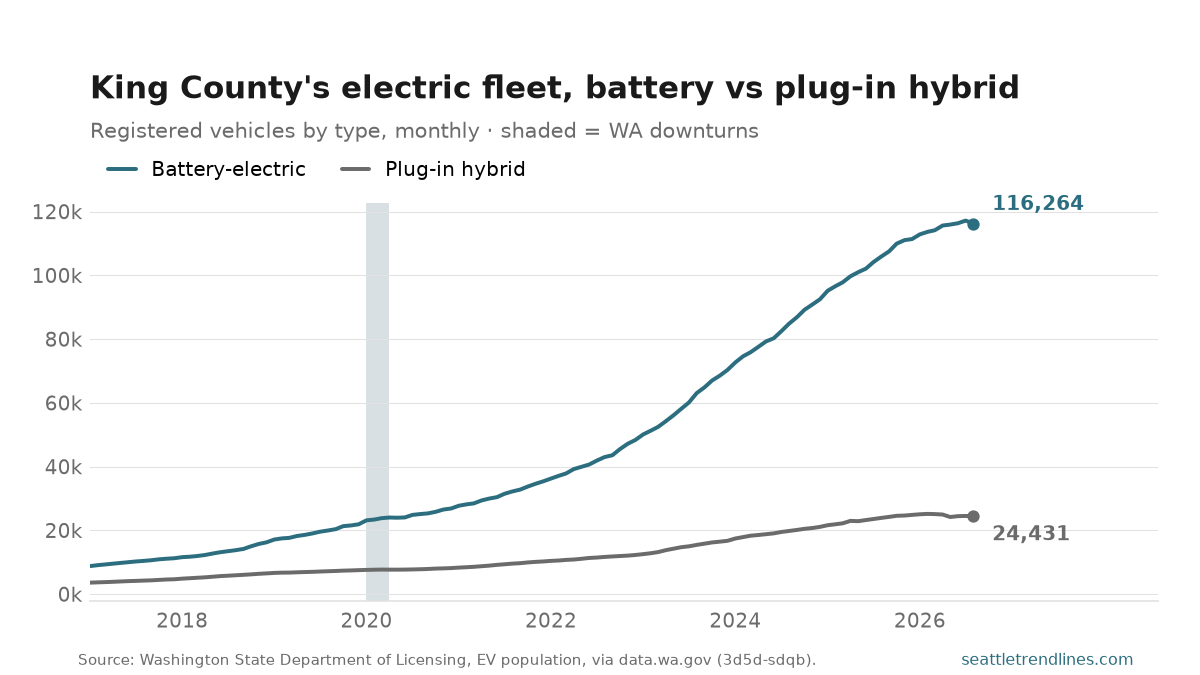
King County had 116,264 battery-electric vehicles and 24,431 plug-in hybrids registered in August 2026 — batteries are 83% of the county’s electric fleet. The battery count is up 9.8% from a year earlier.
The split is the interesting part. Plug-in hybrids were the hedge — battery for the commute, petrol for the mountain pass — and the two lines started the series close together. They are not close now, which is a statement about how far charging infrastructure and range have come rather than about policy.
Registrations are a stock, not sales: this is what was on the road that month.
Source: Washington State Department of Licensing, Electric Vehicle Population, King County, via data.wa.gov (Socrata 3d5d-sdqb). Auto-generated each build.
What’s coming on seattletrendlines.com the week of September 21–25 — 14 posts on the calendar.
Monday, September 21 — Who owns their home in King County, 2024 (pending — its numbers haven’t landed yet); King County’s electric fleet, August 2026; Electric vehicles on Washington roads, August 2026.
Tuesday, September 22 — What Seattle reports to the city, August 2026; What a Seattle-area house is worth, August 2026; How many people live in a King County home, 2024 (pending — its numbers haven’t landed yet); Hospitality’s share of Seattle jobs, August 2026.
Wednesday, September 23 — Seattle wages after inflation, August 2026; Manufacturing’s share of Seattle jobs, August 2026; Seattle-metro payrolls, August 2026.
Thursday, September 24 — Washington jobless claims, week of Sep 12, 2026; Seattle-metro manufacturing jobs, August 2026.
Friday, September 25 — Seattle-metro construction jobs, August 2026; Restaurant and hotel jobs, August 2026.
This is the plan, not a promise. Every weekday post here is tied to a data release, and a release that slips takes its post with it — the post simply waits for the day its numbers land. A figure that arrives early, a revision worth writing about, or an unexpected story out of Seattle can just as easily add a post that isn’t on this list. Expect the week to look roughly like this, and expect at least one day of it not to.
The week of September 14–18 on seattletrendlines.com, in 10 posts.
Monday, September 14 — Sounder commuter rail, July 2026. Sounder carried 177,833 boardings in July 2026, down 5.3% on the year — against a peak of 442,159 in October 2019, which makes it 60% below its high-water mark.
Monday, September 14 — Washington State Ferries ridership, July 2026. Washington State Ferries carried 2,317,416 passengers in July 2026, up 0.6% from a year earlier.
Tuesday, September 15 — Seattle’s crime rate, July 2026. Seattle recorded 1.36 offences against persons per 1,000 residents in July 2026, and 4.60 offences against property per 1,000.
Tuesday, September 15 — Seattle’s crimes against society, July 2026. Seattle police recorded 602 crimes against society in July 2026, up 24.9% from a year earlier.
Wednesday, September 16 — Seattle gas prices, August 2026. The Seattle-area average price of regular gasoline was $5.32 a gallon in August 2026, up 16.9% from a year earlier. Monthly update to the gas-price post; figures are nominal (not inflation-adjusted).
Wednesday, September 16 — Washington business applications, August 2026. Washingtonians filed 8,747 new business applications in August 2026, up 8.9% from a year earlier.
Thursday, September 17 — Seattle gas in today’s dollars, August 2026. A gallon of regular cost $5.32 at the Seattle pump in August 2026. The line is deflated to the latest month, so today’s price is its own real price; the work is done on the old ones.
Thursday, September 17 — Seattle inflation against the country, August 2026. Seattle-metro prices were 4.4% higher than a year earlier in August 2026; nationally the figure was 3.4%. The gap is 1.0 points, with Seattle running hotter this month.
Friday, September 18 — Buy or rent: the Seattle ratio, August 2026. The typical Seattle-area home was worth $727,359 in August 2026, and the typical asking rent was $2,278 a month. Divide the first by a year of the second and you get the price-to-rent ratio: 26.6.
Friday, September 18 — Seattle asking rents, August 2026. The typical asking rent in the Seattle metro was $2,278 a month in August 2026, up 1.7% from a year earlier.
The week in review: every post from September 14–18, summarised from its own listing blurb and linked. Assembled each Saturday from the posts that actually published that week.
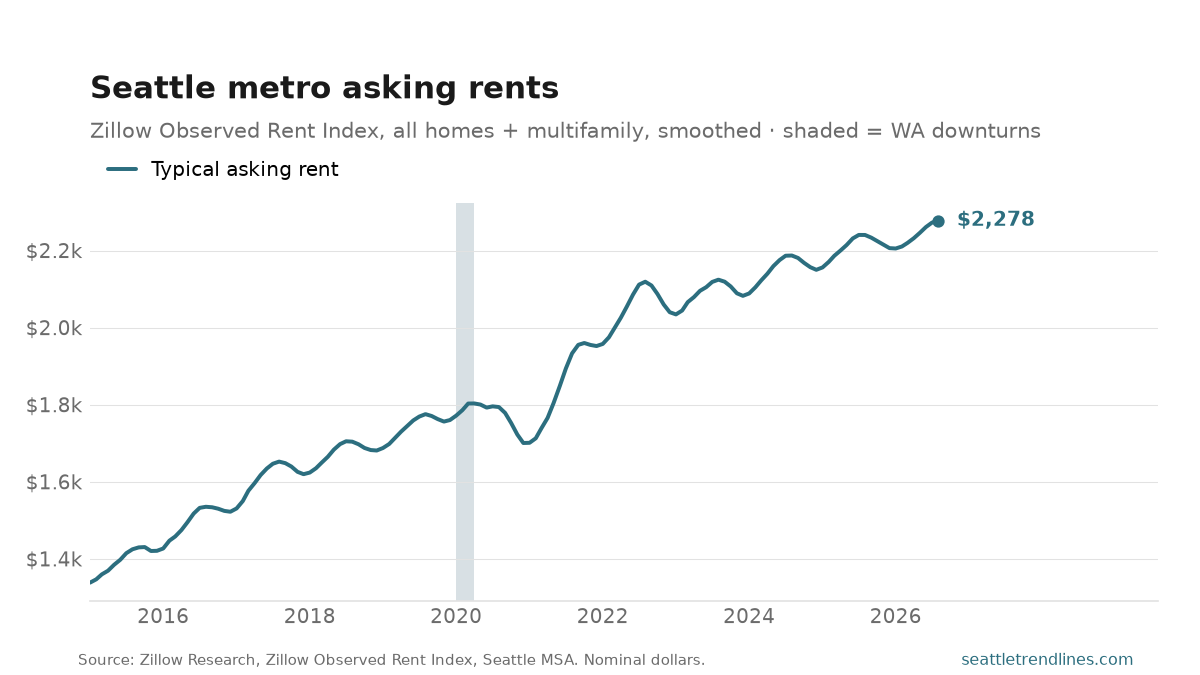
The typical asking rent in the Seattle metro was $2,278 a month in August 2026, up 1.7% from a year earlier. ZORI tracks new leases, not the average rent paid across all tenants, so it turns roughly a year before the rent component of the local CPI does — which makes it the leading indicator of the two. Nominal dollars.
Source: Zillow Research, Zillow Observed Rent Index (ZORI), Seattle–Tacoma–Bellevue MSA, smoothed, all homes plus multifamily, nominal dollars. Auto-generated each build.