What’s coming on seattletrendlines.com the week of September 7–11 — 10 posts, two a day, every weekday.
Monday, September 7 — King County asking prices, August 2026; King County homes under contract, August 2026.
Tuesday, September 8 — How long a King County listing sits, August 2026; Seattle-metro unemployment, July 2026.
Wednesday, September 9 — Seattle’s labor force, July 2026; Link light rail ridership, July 2026.
Thursday, September 10 — King County Metro bus ridership, July 2026; Seattle’s air, April 2026 (pending — its numbers haven’t landed yet).
Friday, September 11 — Seattle offences against persons, July 2026; Seattle offences against property, July 2026.
This is the plan, not a promise. Every weekday post here is tied to a data release, and a release that slips takes its post with it — the post simply waits for the day its numbers land. A figure that arrives early, a revision worth writing about, or an unexpected story out of Seattle can just as easily add a post that isn’t on this list. Expect the week to look roughly like this, and expect at least one day of it not to.
The week of August 31 – September 4 on seattletrendlines.com, in 9 posts.
Monday, August 31 — Thirty years of Seattle school spending, to 2022. Seattle Public Schools spent $23,519 per pupil in 2022, in constant dollars — down 2.1% on the year, and 72% above the series low of $13,702 in 1995. The real peak was $24,313 in 2020.
Tuesday, September 1 — King County’s share of Washington’s EVs, July 2026. 48.5% of Washington’s electric vehicles were registered in King County in July 2026 — 140,695 of the state’s 291,146. The share was 57.0% at its height, in February 2017.
Tuesday, September 1 — Seattle building permits, July 2026. On a trailing 12-month basis, the Seattle metro permitted 20,712 housing units through July 2026, up 35.8% from a year earlier. This updates the permit slump; the 12-month sum smooths the monthly noise so the trend is the signal.
Wednesday, September 2 — What share of Seattle works where, July 2026. Information employers were 6.2% of all Seattle-metro payrolls in July 2026; manufacturers were 7.8%. In 1990 manufacturing was 18% and nothing else came close.
Wednesday, September 2 — Battery or plug-in hybrid, July 2026. Washington registered 235,196 battery-electric vehicles and 57,080 plug-in hybrids in July 2026. Batteries are 80% of the state’s electric fleet, and their count is up 15.9% on the year.
Thursday, September 3 — Sea-Tac against normal, August 2026. August 2026 at Sea-Tac ran 0.9°F above normal. Normal here is the 1991-2020 average for that same month, which is the standard climate baseline — so this is a comparison with the recent past, not with the start of the record.
Thursday, September 3 — Construction’s share of Seattle jobs, July 2026. Construction and mining was 5.7% of Seattle-metro payroll jobs in July 2026 — 124,000 jobs. The share peaked at 7.5% in August 2007 and bottomed at 4.5% in January 2012.
Friday, September 4 — King County for-sale inventory, August 2026. King County ended August 2026 with 7,366 active for-sale listings, up 27.4% from a year earlier — the monthly update to King County’s inventory rebuild.
Friday, September 4 — What King County sellers listed, August 2026. King County sellers put 2,512 new listings on the market in August 2026, up 12.3% from the same month a year earlier.
The week in review: every post from August 31 – September 4, summarised from its own listing blurb and linked. Assembled each Saturday from the posts that actually published that week.
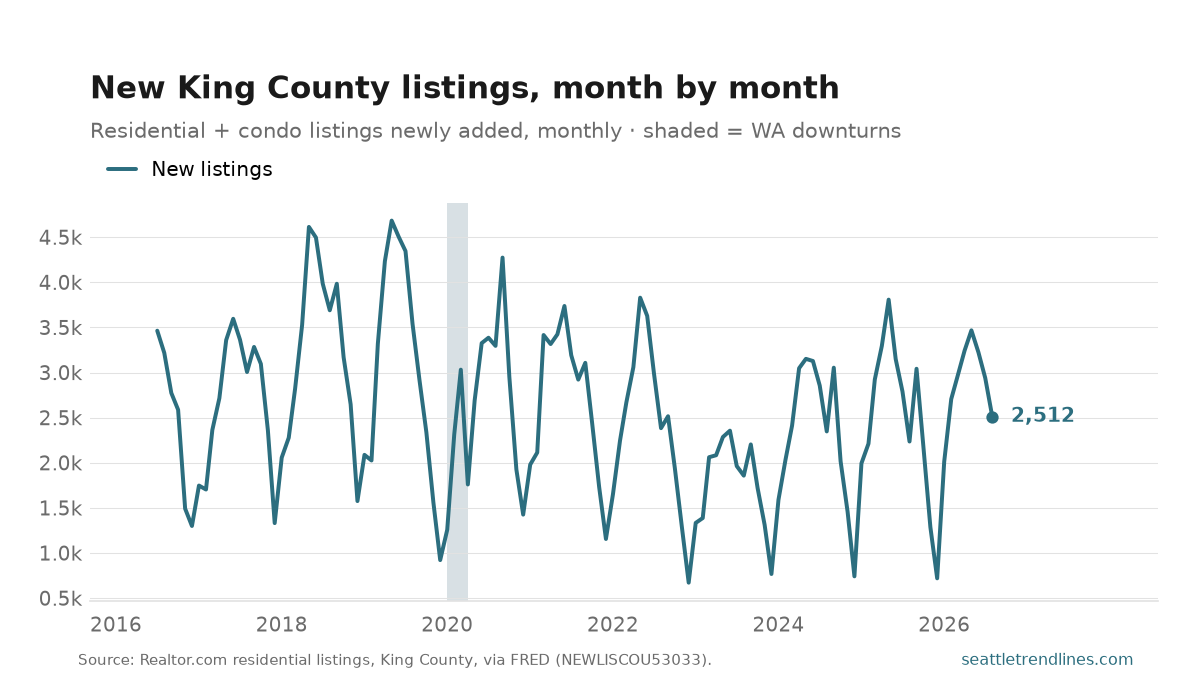
King County sellers put 2,512 new listings on the market in August 2026, up 12.3% from the same month a year earlier. The year-over-year comparison is the only fair one here: this series has a spring peak and a December trough every single year, so a fall from June to November says nothing except that it got dark.
New listings are the supply side of the inventory number — what sellers add, rather than what is sitting unsold. The two move apart when demand shifts: inventory can climb on flat new listings if buyers stop absorbing them.
Source: Realtor.com new residential listings, King County WA, via FRED NEWLISCOU53033. Auto-generated each build.
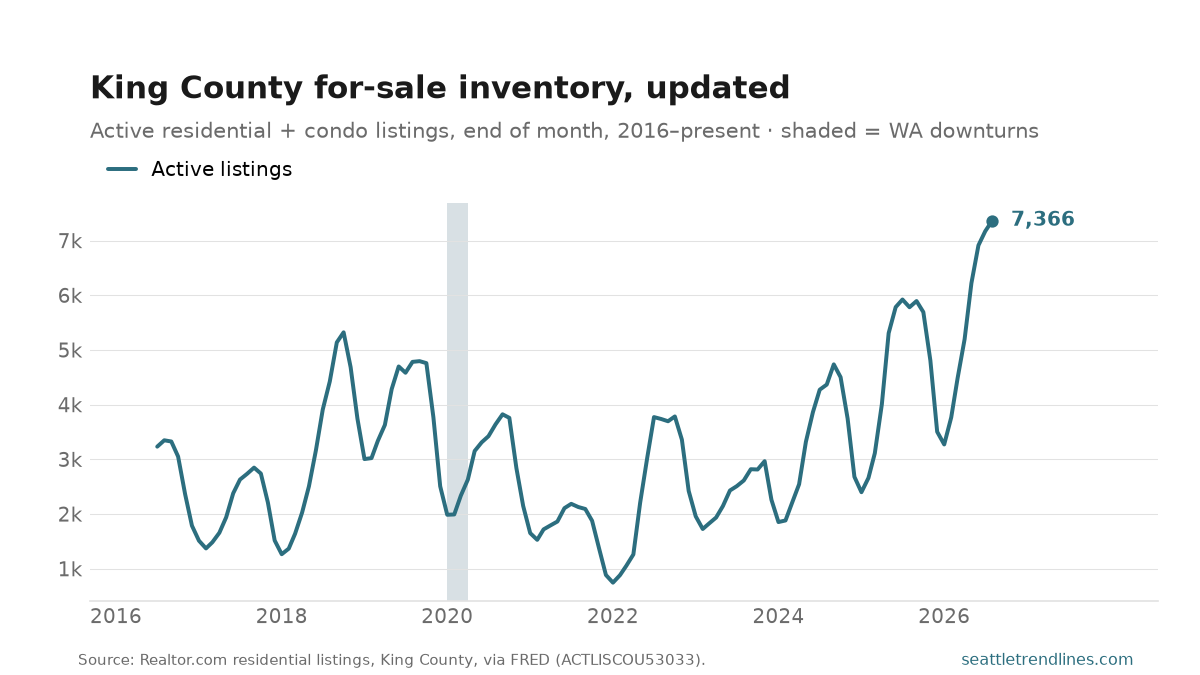
King County ended August 2026 with 7,366 active for-sale listings, up 27.4% from a year earlier — the monthly update to King County’s inventory rebuild.
Source: Realtor.com residential listing inventory, King County WA, via FRED ACTLISCOU53033. Auto-generated each build.
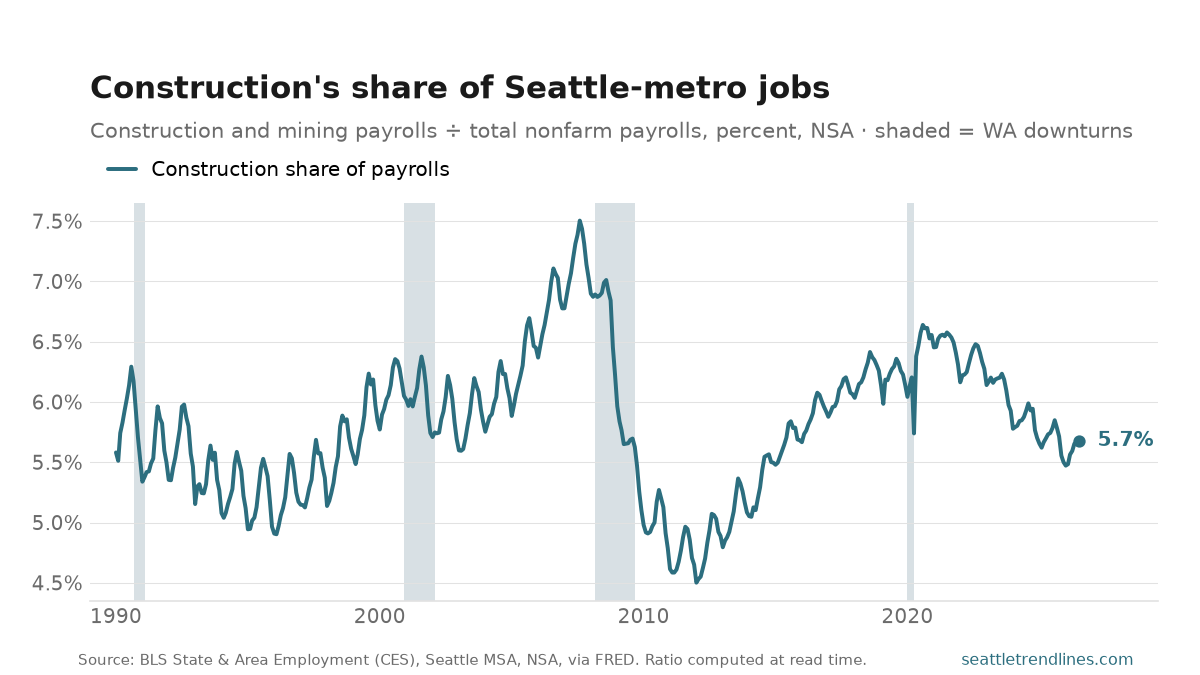
Construction and mining was 5.7% of Seattle-metro payroll jobs in July 2026 — 124,000 jobs. The share peaked at 7.5% in August 2007 and bottomed at 4.5% in January 2012.
This is the closest thing the site has to a building-cycle indicator that is not about permits. It measures how much of the region’s labour is pointed at construction, and unlike the job count it cannot be flattered by an economy that is simply larger than it used to be — the share fell by nearly a third after 2007 while the metro kept adding jobs everywhere else.
Numerator and denominator are the same BLS release for the same metro, so the share stays consistent through revisions, and it is computed at read time rather than stored. Not seasonally adjusted: construction has a real summer, so compare to the same month a year earlier.
Source: U.S. Bureau of Labor Statistics, State & Area Employment, mining, logging and construction against total nonfarm payrolls, Seattle–Tacoma–Bellevue MSA, not seasonally adjusted, via FRED. The share is derived at read time. Auto-generated each build.
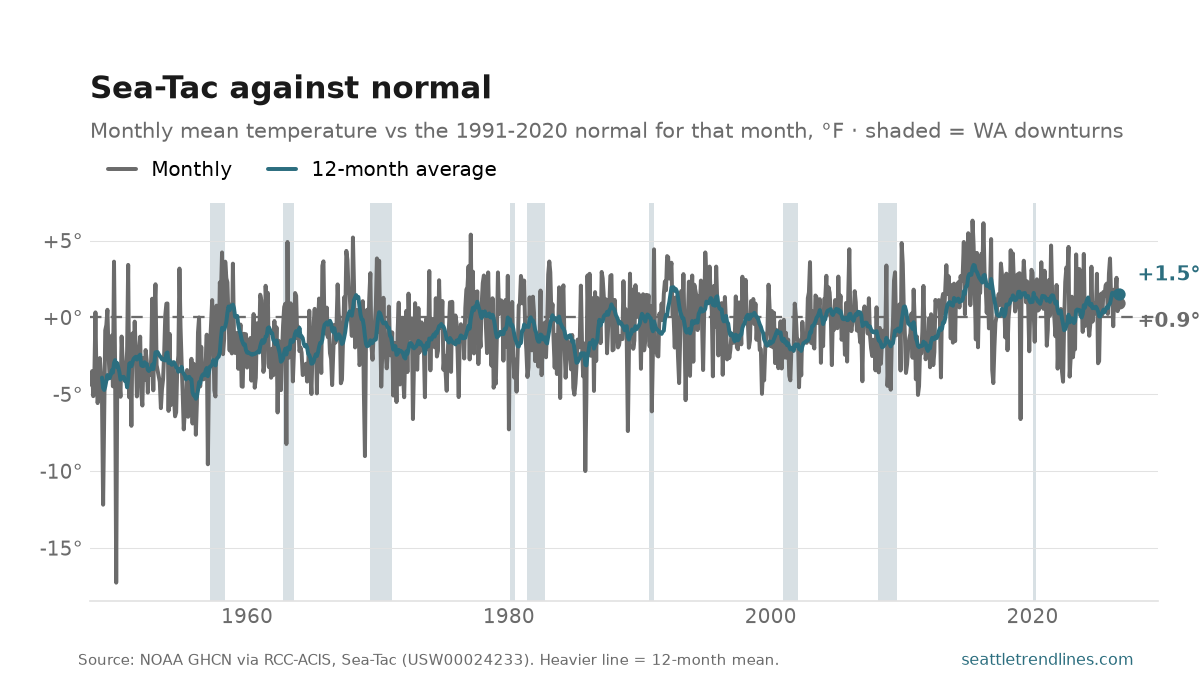
August 2026 at Sea-Tac ran 0.9°F above normal. Normal here is the 1991-2020 average for that same month, which is the standard climate baseline — so this is a comparison with the recent past, not with the start of the record.
Across the whole series, August has averaged -1.1°F against that baseline, over 79 years. The warmest was +4.3 (1967) and the coldest -6.2 (1954). A single month is weather; the reason to post one every month is that the band they fall in has moved — which is what the 12-month average on the chart is there to show.
The station is the caveat, and it is a real one. Sea-Tac is the only continuous daily record in this region back to 1948, and it is an airport twelve miles south of downtown with far more tarmac around the thermometer than it had then. Some of the drift in this line is the airport growing, not the climate — that is why the anomaly is measured against a fixed 1991-2020 baseline rather than against the 1950s, which would read the pavement as warming. It is still the best record there is.
Source: NOAA Global Historical Climatology Network daily records for Seattle-Tacoma International Airport (USW00024233), via RCC-ACIS, aggregated to monthly means and differenced against the 1991-2020 normal for each calendar month. Auto-generated each build.
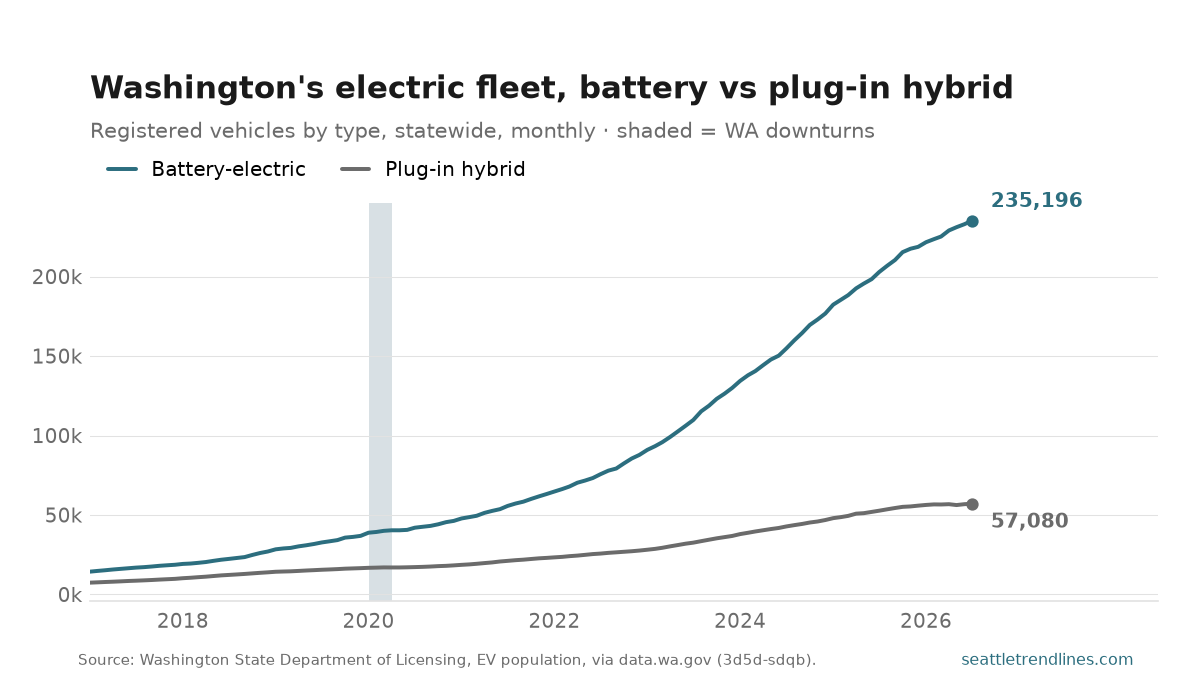
Washington registered 235,196 battery-electric vehicles and 57,080 plug-in hybrids in July 2026. Batteries are 80% of the state’s electric fleet, and their count is up 15.9% on the year.
Statewide the gap is wider than King County’s, which is the opposite of what the geography would suggest: the plug-in hybrid is the car for long drives and thin charging networks, so a rural state might have been expected to keep more of them. It has not. Whatever is driving the shift to full battery is not a Seattle phenomenon.
A stock rather than sales — the vehicles registered in that month.
Source: Washington State Department of Licensing, Electric Vehicle Population, statewide, via data.wa.gov (Socrata 3d5d-sdqb). Auto-generated each build.
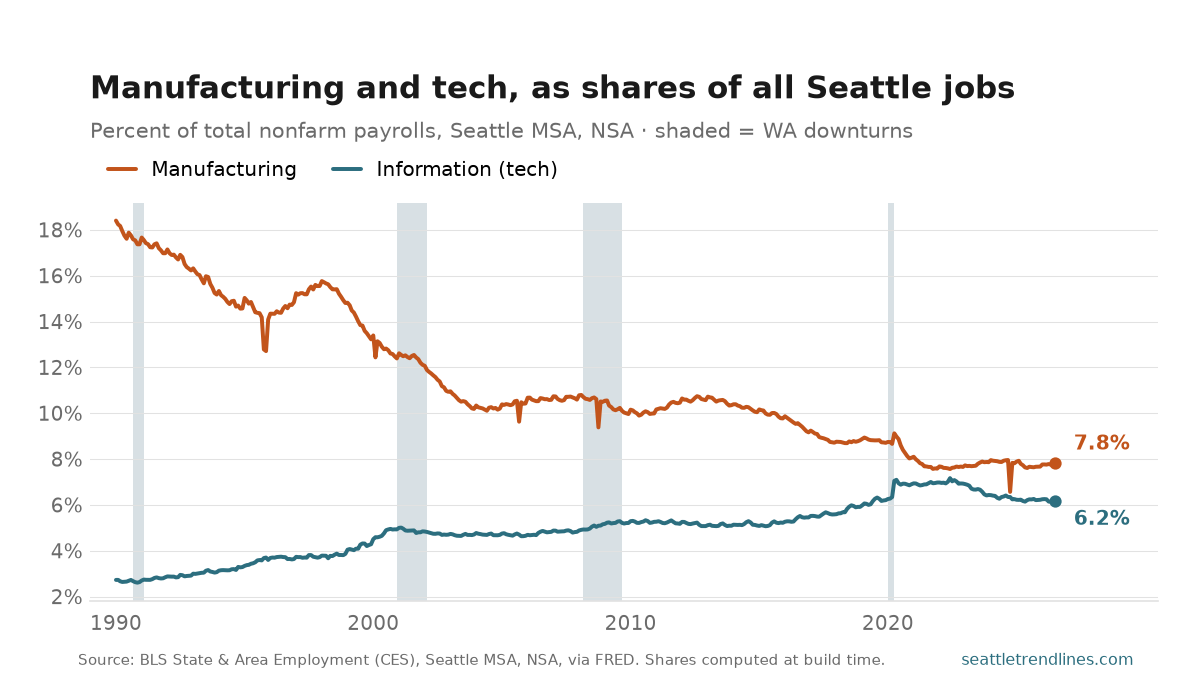
Information employers were 6.2% of all Seattle-metro payrolls in July 2026; manufacturers were 7.8%. In 1990 manufacturing was 18% and nothing else came close.
Tech versus aerospace charts these two as head counts, and head counts both grew for most of the period — which makes the transition look gentler than it was. As shares of a metro economy that roughly doubled in size, the picture is a straightforward substitution: one sector’s claim on the region’s payroll more than halved, the other’s roughly doubled, and they crossed.
‘Information’ is not ‘tech’, and the gap is large enough to matter. NAICS puts software publishers, telecoms and media in Information, but it classifies Amazon under retail and cloud infrastructure largely under other headings — so the real technology share of Seattle employment is well above 6.2%. Read the line as a floor and, more usefully, as a trend: the classification has been consistent throughout, so the shape is right even where the level understates.
Both series are the same BLS metro release, so numerator and denominator are revised together and the share stays internally consistent. Not seasonally adjusted; the single-month notches in manufacturing are Boeing machinist strikes.
Source: U.S. Bureau of Labor Statistics, State & Area Employment (CES), Seattle–Tacoma–Bellevue MSA, not seasonally adjusted, via FRED (SEAT653INFON, SEAT653MFGN, SEAT653NAN). Each share is the sector divided by total nonfarm payrolls, computed at build time rather than stored. Auto-generated each build.
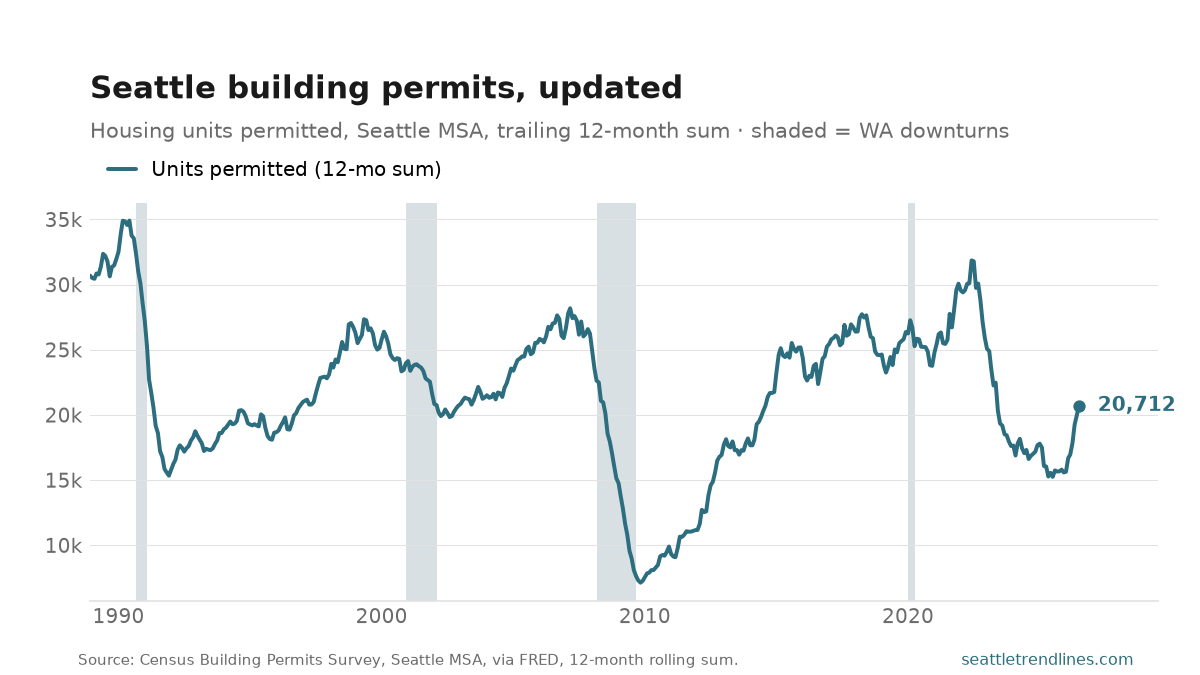
On a trailing 12-month basis, the Seattle metro permitted 20,712 housing units through July 2026, up 35.8% from a year earlier. This updates the permit slump; the 12-month sum smooths the monthly noise so the trend is the signal.
Source: U.S. Census Bureau Building Permits Survey, Seattle–Tacoma–Bellevue MSA, trailing 12-month sum. Auto-generated each build.
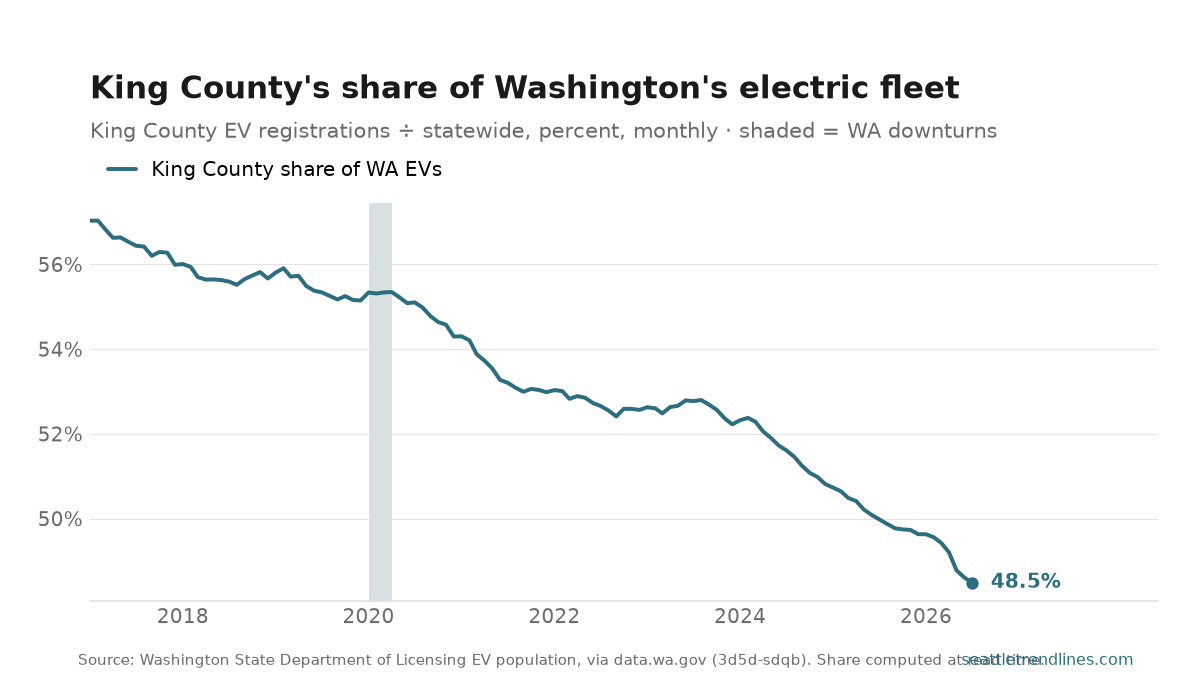
48.5% of Washington’s electric vehicles were registered in King County in July 2026 — 140,695 of the state’s 291,146. The share was 57.0% at its height, in February 2017.
A falling share on a rising count is the interesting shape, and it is what this chart shows: King County has more electric cars every month and a smaller slice of the state’s every month. Early adoption was concentrated here — one county held more than half the state’s EVs — and the rest of Washington has been catching up ever since. The story of EV adoption is now happening outside Seattle.
A share of a whole rather than a rate: numerator and denominator are the same Department of Licensing release, so the figure is exact. Note it is not a per-capita measure — King County holds about a third of the state’s people, so a share near half still means EVs are over-represented here.
Source: Washington State Department of Licensing, Electric Vehicle Population, via data.wa.gov (Socrata 3d5d-sdqb). The share is derived at read time from the county and statewide series. Auto-generated each build.