The week of September 7–11 on seattletrendlines.com, in 9 posts.
Monday, September 7 — King County asking prices, August 2026. The median King County listing asked $849,000 in August 2026, down 1.3% from a year earlier.
Monday, September 7 — King County homes under contract, August 2026. 1,969 King County listings were under contract at the end of August 2026, down 17.0% from a year earlier.
Tuesday, September 8 — How long a King County listing sits, August 2026. The median King County listing sat 45 days on the market in August 2026, against 45 days a year earlier.
Tuesday, September 8 — Seattle-metro unemployment, July 2026. Seattle-metro unemployment was 5.0% in July 2026, the newest month in the series and the monthly update to the unemployment post. That is up 0.4 points from 4.6% in the same month a year earlier, and unchanged the month before.
Wednesday, September 9 — Link light rail ridership, July 2026. Link carried 5,205,705 boardings in July 2026, up 41.8% from a year earlier. The record month is 5,205,705 (July 2026); today’s figure is 0% above it.
Wednesday, September 9 — Seattle’s labor force, July 2026. The Seattle–Tacoma–Bellevue labor force — everyone employed or actively looking for work — was 2,296,029 in July 2026, down 0.7% from a year earlier.
Thursday, September 10 — King County Metro bus ridership, July 2026. King County Metro carried 7,757,126 bus boardings in July 2026, up 0.2% on the year. The peak in this series is 11,328,648 (October 2019), which puts the latest month 32% below it.
Friday, September 11 — Seattle offences against persons, July 2026. Seattle police recorded 1,119 offences against persons in July 2026, down 4.4% from a year earlier.
Friday, September 11 — Seattle offences against property, July 2026. Seattle police recorded 3,787 offences against property in July 2026, down 7.6% from a year earlier.
The week in review: every post from September 7–11, summarised from its own listing blurb and linked. Assembled each Saturday from the posts that actually published that week.
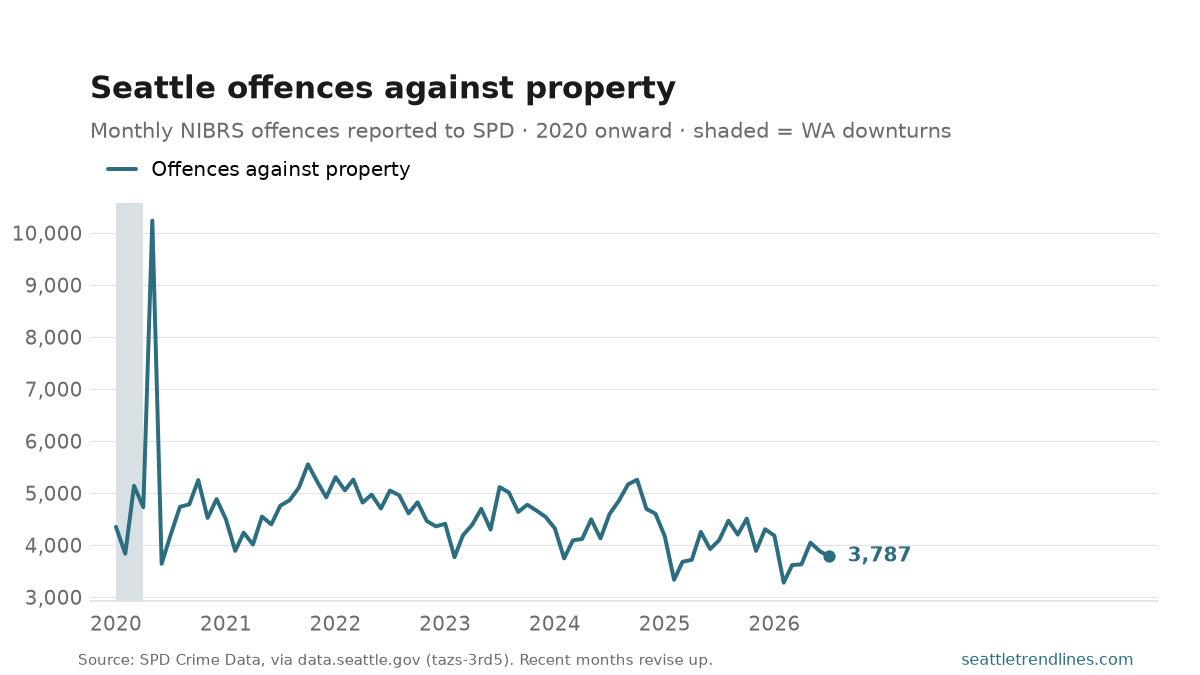
Seattle police recorded 3,787 offences against property in July 2026, down 7.6% from a year earlier. This is the bulk of reported crime in the city — burglary, car prowls, vehicle theft, shoplifting — and when a single ‘crime is up’ figure is quoted anywhere, this category is most of what moved it.
The one-month spike in May 2020 is the night of widespread downtown break-ins during the George Floyd protests. It is one event and it is left in the chart rather than smoothed away.
As always: reported crime, offences rather than incidents, and recent months revise upward. The chart starts in 2020 because of SPD’s 2019 records-system change.
Source: Seattle Police Department, SPD Crime Data 2008-Present, via data.seattle.gov (Socrata tazs-3rd5), NIBRS crimes-against-property category. Auto-generated each build.
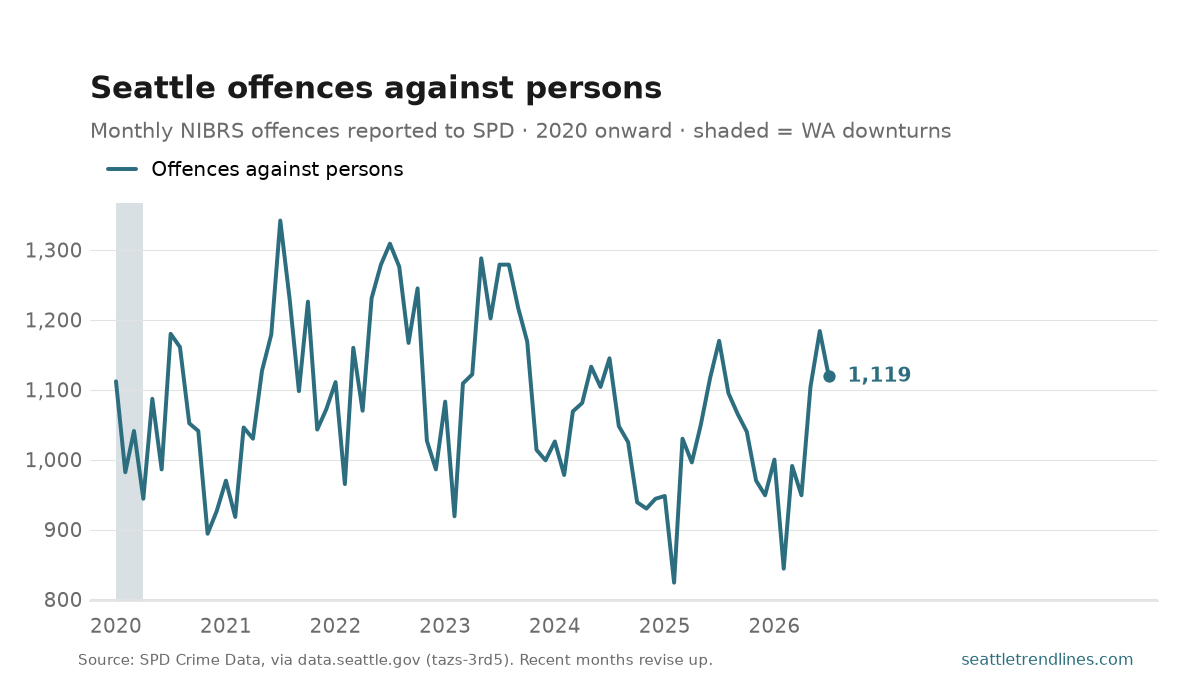
Seattle police recorded 1,119 offences against persons in July 2026, down 4.4% from a year earlier. This is the assault, robbery and homicide category — the offences with a victim who was there — and it is the one worth watching on its own rather than inside a combined crime total, where property offences outnumber it three to one and drown it out.
Three caveats carry every month. This counts crime reported to police, so it moves with reporting behaviour as well as with crime. It counts offences, not incidents. And recent months revise upward as late reports land, so the right-hand edge is provisional. For the same number with the city’s growth divided out, see the crime rate post. The chart starts in 2020 because SPD changed records systems in 2019 and the counts either side are not comparable.
Source: Seattle Police Department, SPD Crime Data 2008-Present, via data.seattle.gov (Socrata tazs-3rd5), NIBRS crimes-against-persons category. Auto-generated each build.
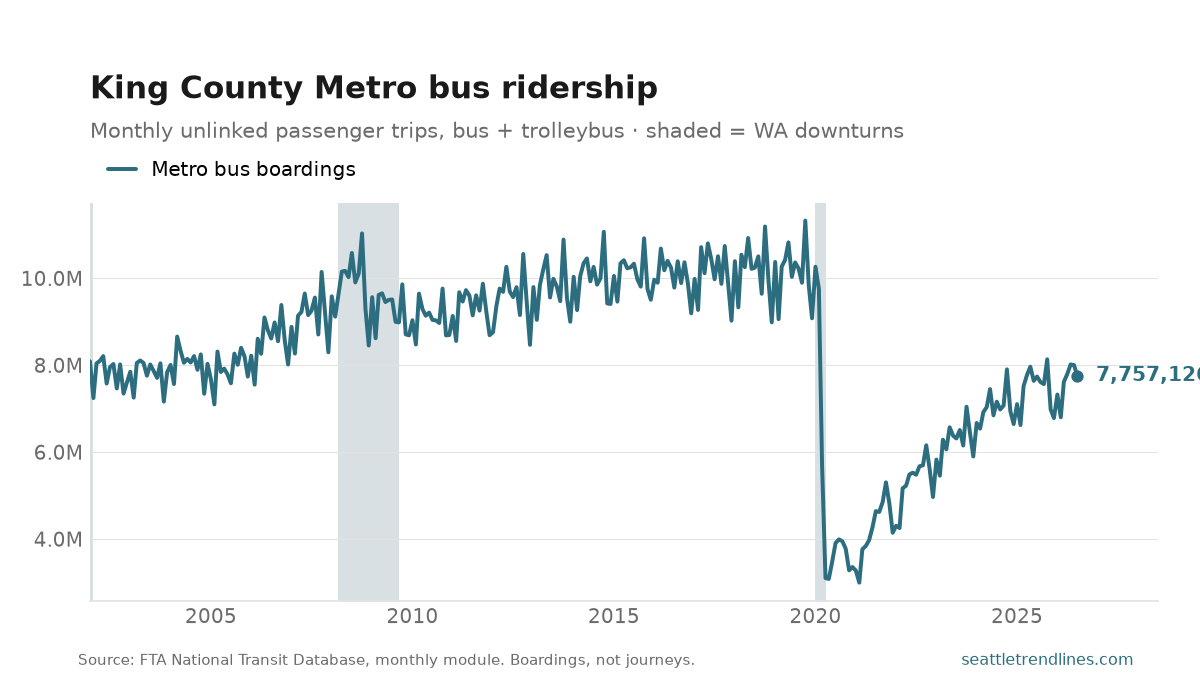
King County Metro carried 7,757,126 bus boardings in July 2026, up 0.2% on the year. The peak in this series is 11,328,648 (October 2019), which puts the latest month 32% below it.
The bus is the part of the transit system that mostly does not get written about, and it carries far more people than the train does. It is also the better economic indicator of the two: the bus network has not changed shape the way the rail network has, so its ridership moves with commuting, employment and the cost of driving rather than with construction schedules. The gap between the bus line and the rail line since 2020 is the clearest picture available of how office work changed in this region.
Trolleybus routes are included with the diesel and hybrid fleet — they are one network to a rider and splitting them would chart the vehicle procurement rather than the travel. Boardings, not journeys: a trip with a transfer counts twice. Not seasonally adjusted, so compare with the same month a year earlier.
Source: Federal Transit Administration, National Transit Database monthly module, King County Metro motorbus and trolleybus unlinked passenger trips. Auto-generated each build.
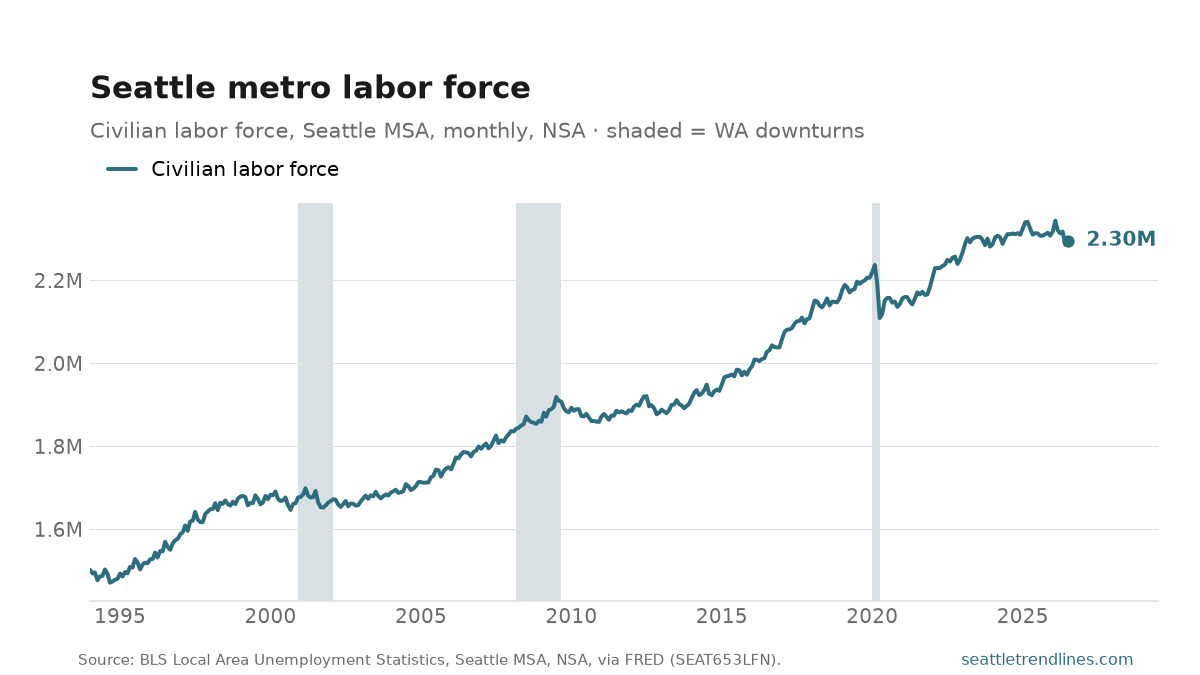
The Seattle–Tacoma–Bellevue labor force — everyone employed or actively looking for work — was 2,296,029 in July 2026, down 0.7% from a year earlier. It’s the head-count denominator under the unemployment rate: a labor force that grows with population and participation. Not seasonally adjusted.
Source: U.S. Bureau of Labor Statistics, Local Area Unemployment Statistics, Seattle–Tacoma–Bellevue MSA civilian labor force, not seasonally adjusted, via FRED SEAT653LFN. Auto-generated each build.
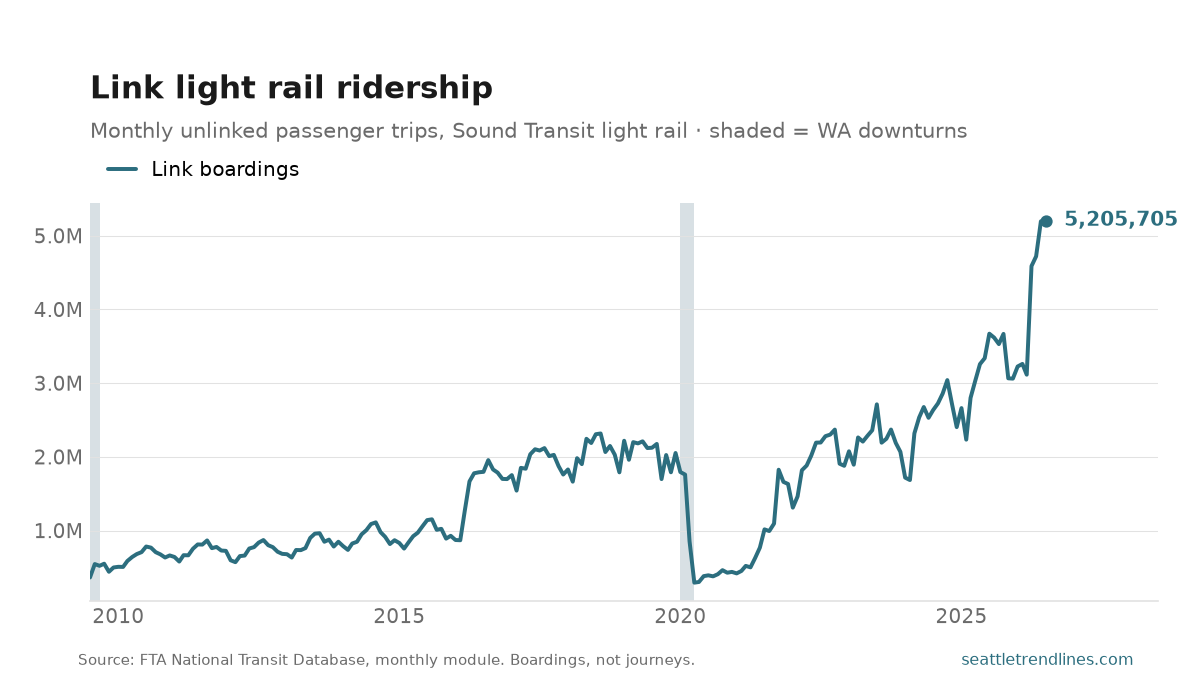
Link carried 5,205,705 boardings in July 2026, up 41.8% from a year earlier. The record month is 5,205,705 (July 2026); today’s figure is 0% above it.
Link is the one Seattle transit number that is not really about the economy: the line keeps getting longer. Extensions to Northgate, the Eastside and Lynnwood each added stations and riders, so a rise here is partly more people riding and partly more railway to ride — which is why the year-over-year comparison matters more than the level, and why a step up in the line usually has an opening date behind it rather than a change in behaviour.
These are boardings, not journeys or people. A trip with a transfer counts twice, so a network that adds a transfer point reports more ridership from the same riders. The figures are Sound Transit’s own submissions to the federal National Transit Database, which is what makes them comparable with the bus and ferry numbers here; the agency’s public tracker uses a slightly different basis and will not always match. Not seasonally adjusted.
The chart starts at the July 2009 opening of Central Link. Sound Transit reported light-rail boardings to the NTD for six years before that, but they are Tacoma’s line — a separate 1.6-mile route at the other end of the corridor, running in the tens of thousands a month — and drawn beside Seattle’s millions they would read as a railway that did not exist yet.
Source: Federal Transit Administration, National Transit Database monthly module, Sound Transit light rail unlinked passenger trips, from the July 2009 opening of Central Link. Auto-generated each build.
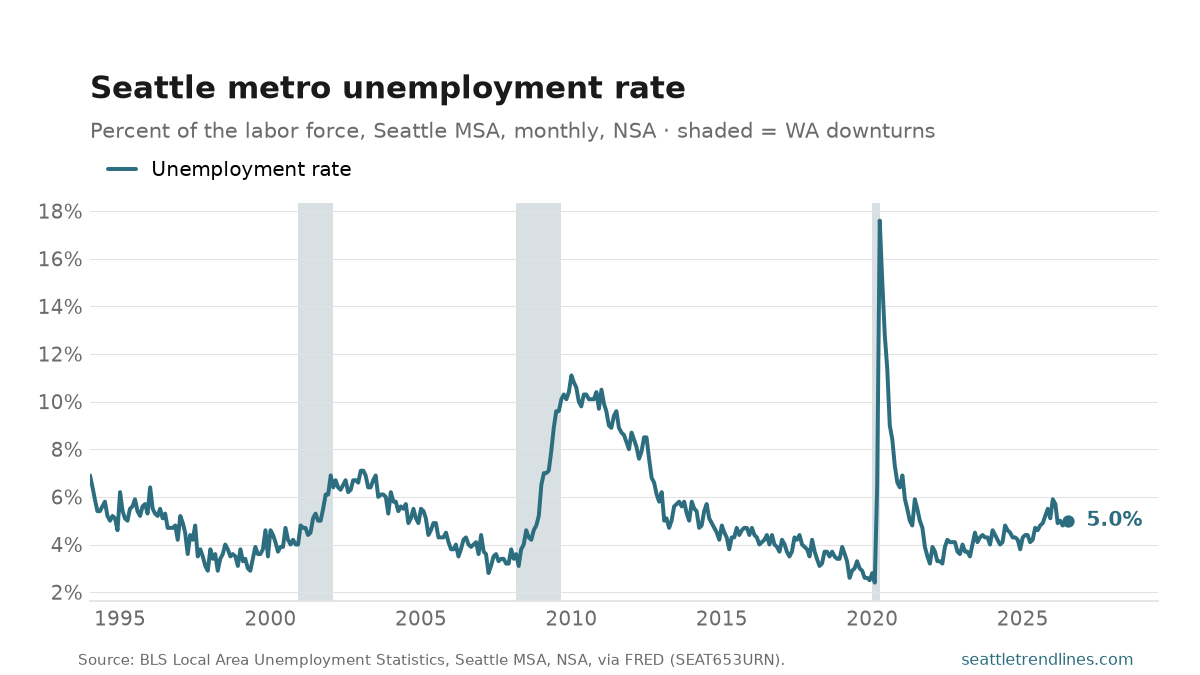
Seattle-metro unemployment was 5.0% in July 2026, the newest month in the series and the monthly update to the unemployment post. That is up 0.4 points from 4.6% in the same month a year earlier, and unchanged the month before. The chart carries the full history back to 1994; the older post’s version of it stops at the month it was published with, so the two lines end in different places on purpose.
The year-ago comparison is the one to trust here. These numbers are not seasonally adjusted, so part of every month-to-month move is just the calendar — hiring for the holidays, students leaving and re-entering the labor force — and only the same month a year earlier strips that out. Keep the scale in mind too: this series ran from 2.4% in February 2020 to 17.6% in April 2020, so a few tenths of a point is a wobble, not a turn. And because the rate is a ratio, it can fall for the wrong reason — people who stop looking for work leave the denominator, and the rate improves with nobody hired.
Source: U.S. Bureau of Labor Statistics, Local Area Unemployment Statistics, Seattle–Tacoma–Bellevue MSA unemployment rate, not seasonally adjusted, via FRED SEAT653URN. Auto-generated each build.
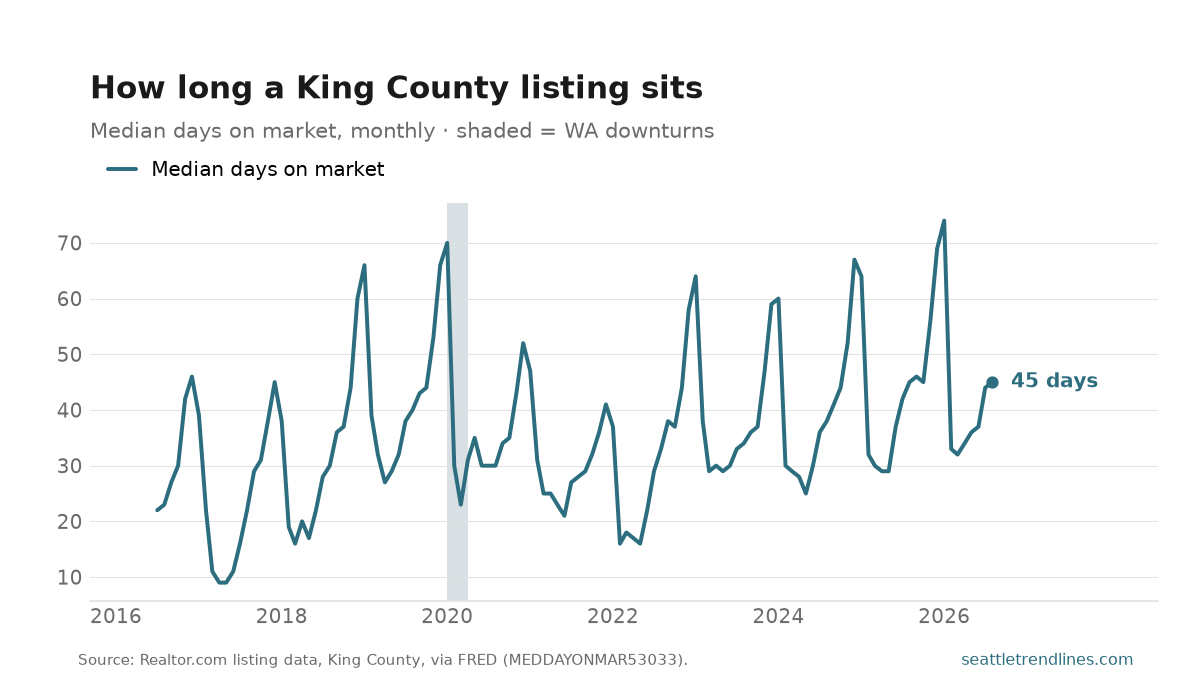
The median King County listing sat 45 days on the market in August 2026, against 45 days a year earlier. Days on market is the market’s pulse rather than its price: it says how long sellers wait, and it moves before asking prices do, because a seller cuts the price only after the waiting has already happened.
The seasonal pattern is severe and it is not a trend — listings move fastest in spring and slowest in December, every year, and the only honest comparison is to the same month a year ago. Over the whole series the fastest month was 9 days (April 2017) and the slowest 74 (January 2026).
Source: Realtor.com median days on market, King County WA, via FRED MEDDAYONMAR53033. Auto-generated each build.
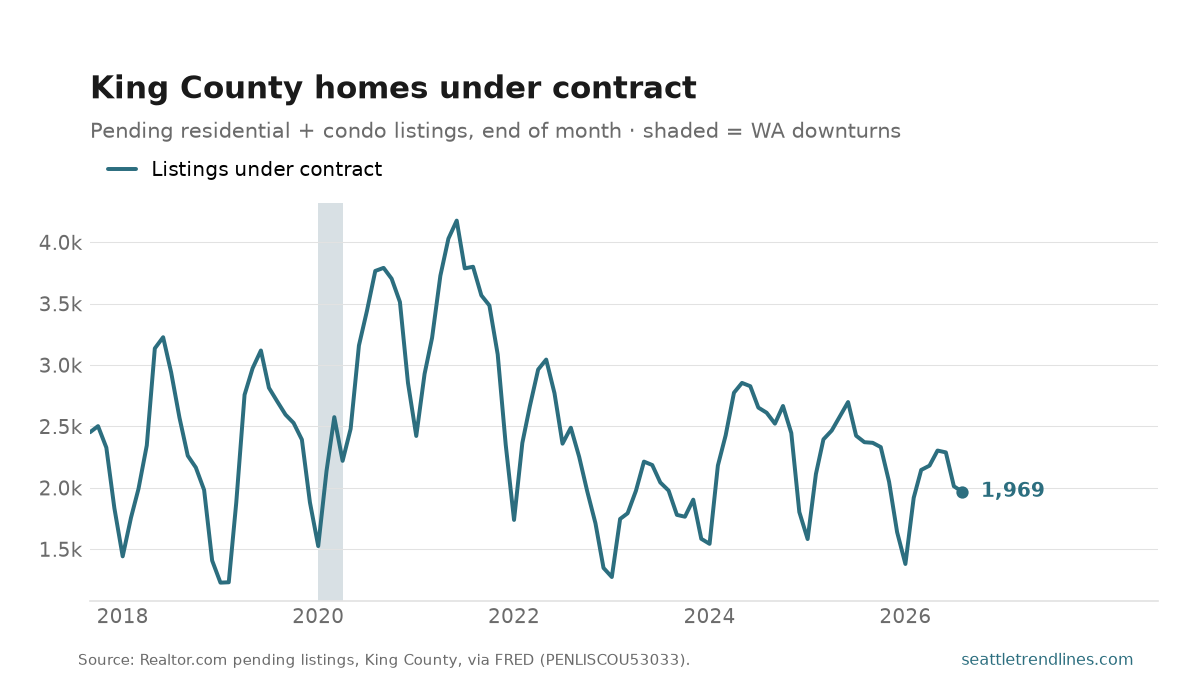
1,969 King County listings were under contract at the end of August 2026, down 17.0% from a year earlier. Pending sales are the closest thing this site carries to a leading indicator of the housing market: a deal goes pending weeks before it closes, so this line turns before recorded sale prices do.
It is also the demand side of the same monthly Realtor.com drop that gives us inventory and asking prices. Inventory rising while pendings fall is a market cooling; both rising together is just a busy spring.
Source: Realtor.com pending residential listings, King County WA, via FRED PENLISCOU53033. Auto-generated each build.
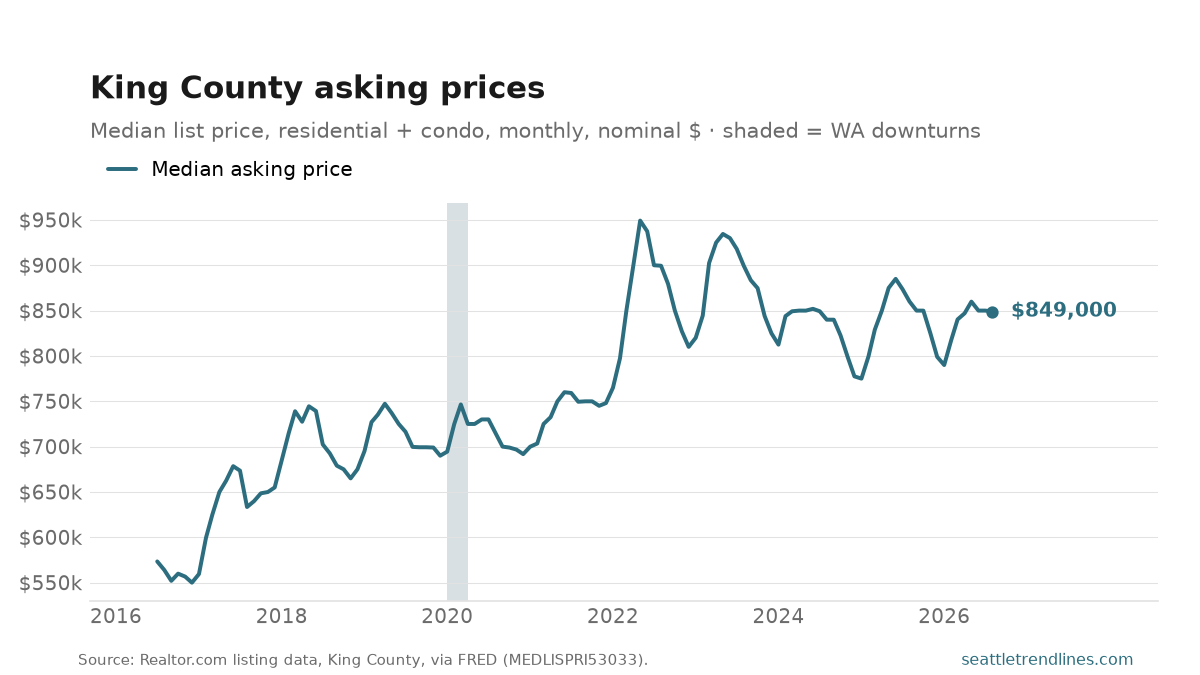
The median King County listing asked $849,000 in August 2026, down 1.3% from a year earlier. Read this as what sellers want, not what buyers pay: it is the midpoint of what is on the market, so it moves with the mix of homes listed as much as with prices. A month heavy on Eastside houses lifts it without anything getting more expensive.
For the price of what actually changes hands, home values is the better series — it holds the mix constant. This one is the faster read, and it is the one sellers are looking at.
Source: Realtor.com median listing price, King County WA, via FRED MEDLISPRI53033, nominal dollars. Auto-generated each build.