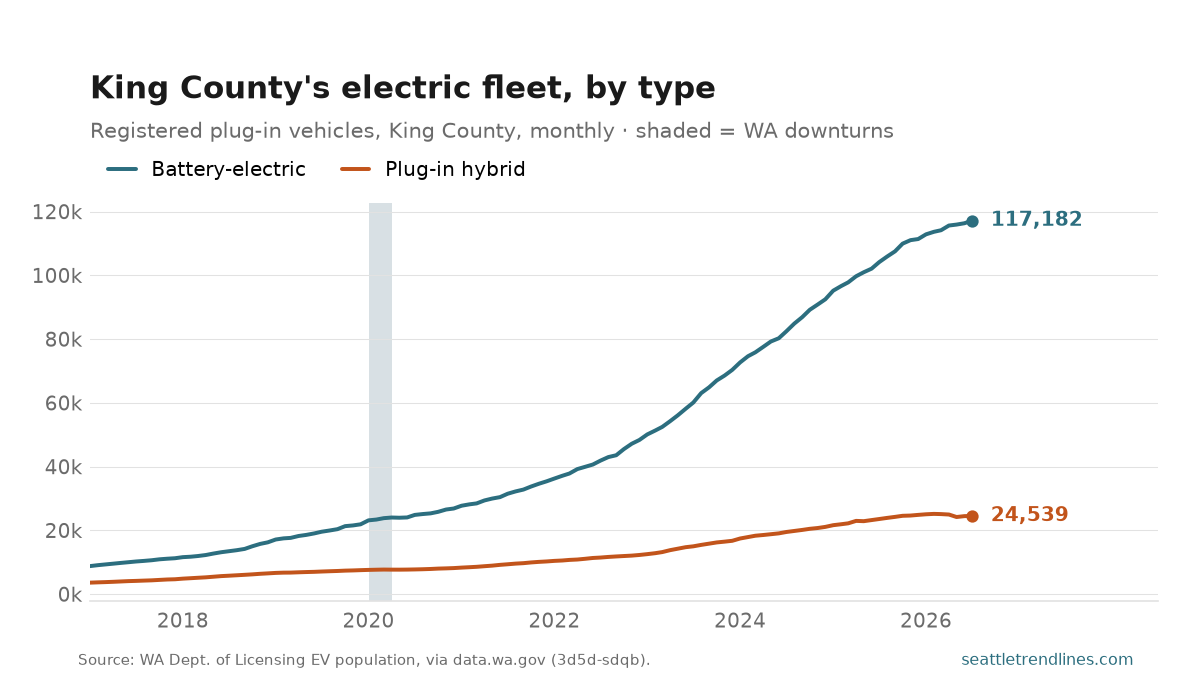
King County had 140,695 plug-in vehicles registered in July 2026. The split is the interesting part: 117,182 battery-electric cars, up 12.5% on the year, against 24,539 plug-in hybrids, up 4.1%. Battery-electrics are 83% of the fleet.
The statewide post charts the total; this is the county underneath it, and the question it answers is whether the plug-in hybrid was a transition or a destination. The two lines have very different slopes, and the gap between them has widened every year — the hybrid with a cord looks less like a step toward the battery car than like a product the battery car went around.
These are registrations in force, not sales: a stock that grows when cars are bought and shrinks when they leave the state or the road, so a month that falls is not a month nobody bought an EV. Vehicles are counted where they are registered, which is the owner’s address rather than where the car is driven.
Source: Washington State Department of Licensing, Electric Vehicle Population Size History By County, via data.wa.gov 3d5d-sdqb, King County rows, registrations in force. Auto-generated each build.
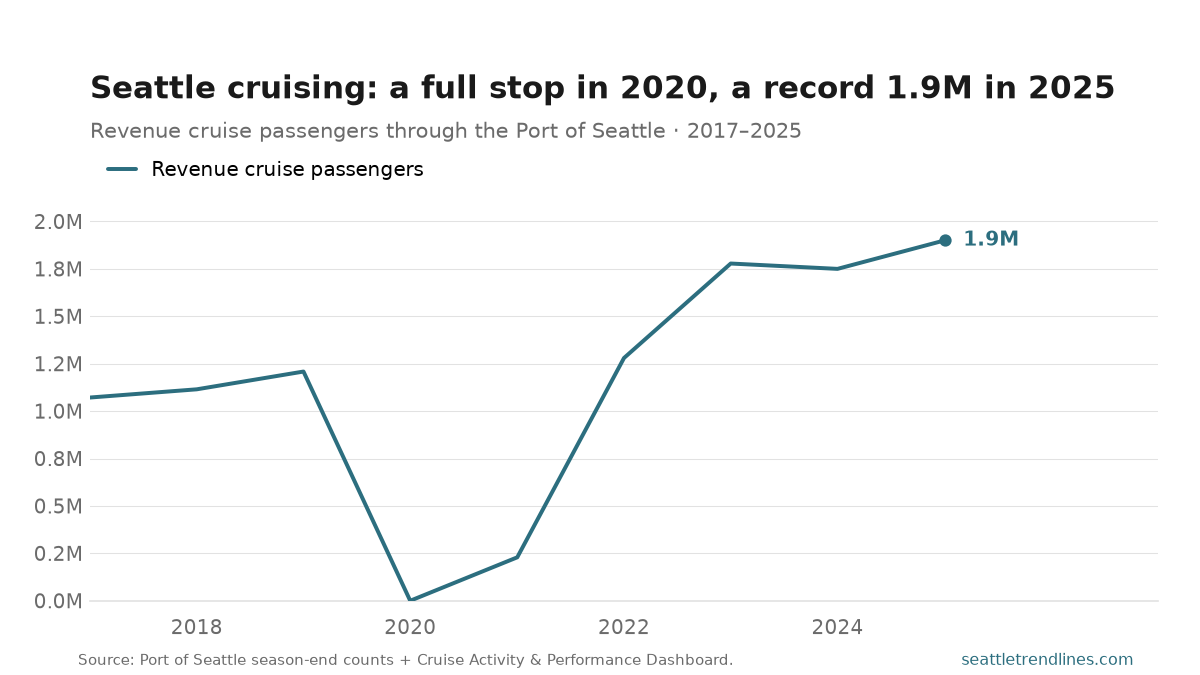
Seattle is the busiest home port for Alaska cruising in the country, and its passenger count is one of the most dramatic V’s you’ll find in any local time series. The Port crossed one million revenue passengers for the first time in 2017 and hit 1.21 million in 2019. Then, in 2020, the season simply didn’t happen — the pandemic cancelled every sailing, and the count went to zero for the first time since scheduled cruising began in 2000. A partial, delayed 2021 season carried about 229,000.
What happened next is the part worth dwelling on: the recovery wasn’t slow. By 2022 — the first normal season back — passenger volume was already at 1.28 million, above the 2019 peak. It has climbed every year since, to 1.78 million in 2023 and a record 1.9 million in 2025, roughly 57% above the pre-pandemic high. Set that against the parts of the Seattle economy still grinding back toward 2019 — downtown office occupancy, transit ridership — and the cruise terminals stand out as the rare sector that didn’t just recover but blew past its old ceiling.
Two caveats keep the number honest. “Revenue passengers” counts each traveler twice — once embarking, once disembarking — so the 1.9 million represents roughly 950,000 individual people (in 2023, 1.78 million revenue passengers were 907,572 individuals). And nearly all of it is packed into a six-month April-to-October season, which is why the working waterfront, the hotels, and Sea-Tac feel it so sharply in summer and not at all in winter. The Port pegs the annual economic impact at about $1.2 billion. From a standing start of six ships and 6,000 passengers in 1999, that’s a quarter-century climb interrupted by exactly one very bad year.
Source: Port of Seattle, season-end cruise counts and Cruise Activity & Performance Dashboard. Figures are revenue passengers (embarking + disembarking) per season; some years are the Port’s officially reported/rounded totals. 2020 = 0 (season cancelled for COVID-19). Updated each fall at season’s end.
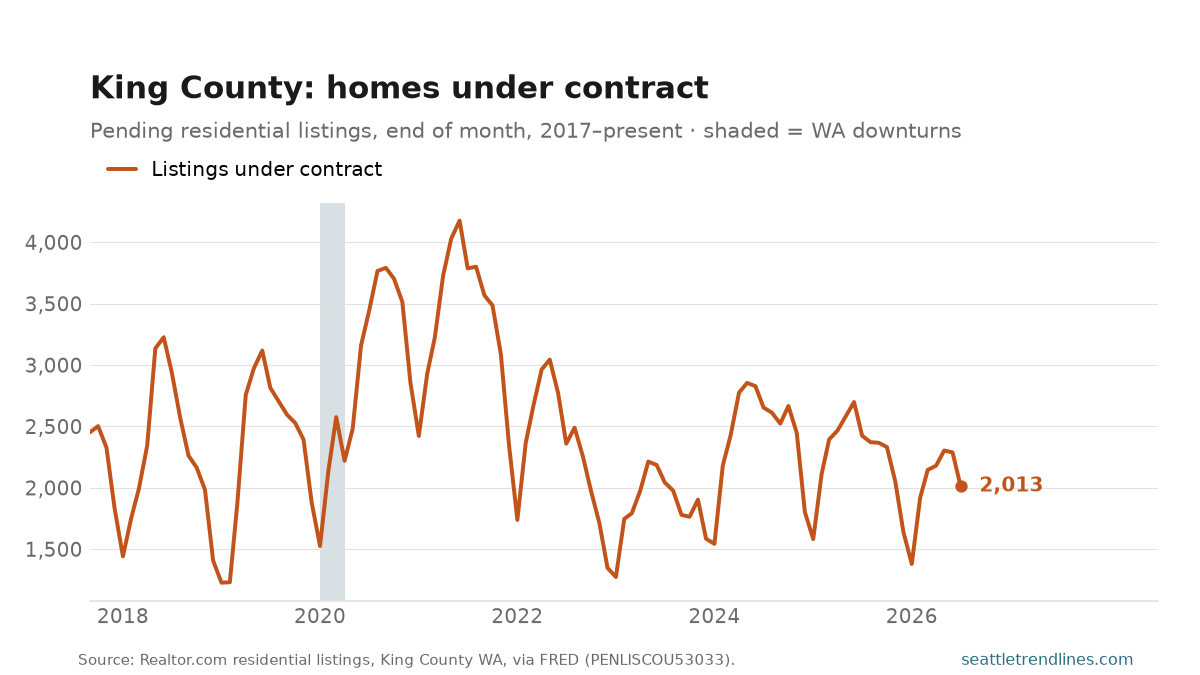
2,013 King County homes were under contract at the end of July 2026, down 17.0% from a year earlier. The count has run between 1,228 (January 2019) and 4,177 (June 2021).
Pending sales are the earliest read on demand in this data. A closed sale is a decision made thirty to forty-five days ago and a price index is slower still; a pending sale is a buyer who committed this month. It is the demand-side twin of new listings, and the two together explain the inventory number better than inventory explains itself.
It is a count of contracts, not of closings — some share falls through on financing or inspection and never becomes a sale. Seasonal, and not seasonally adjusted, so compare with the same month a year earlier.
Source: Realtor.com residential listings, King County WA (FIPS 53033), via FRED PENLISCOU53033. Auto-generated each build.
What’s coming on seattletrendlines.com the week of August 24–28 — 10 posts, two a day, every weekday.
Monday, August 24 — Seattle’s cruise business: from a 2020 shutdown to a record 1.9 million; King County homes under contract, July 2026.
Tuesday, August 25 — New listings per 10,000 King County residents, June 2026; King County’s electric fleet, July 2026.
Wednesday, August 26 — The river Seattle drinks, July 2026; What moves through the gateway, 2025.
Thursday, August 27 — What it costs to keep Seattle comfortable, 2025; City and county, 1990 to 2026.
Friday, August 28 — Seattle’s crimes against society, June 2026; Seattle building permits, July 2026.
This is the plan, not a promise. Every weekday post here is tied to a data release, and a release that slips takes its post with it — the post simply waits for the day its numbers land. A figure that arrives early, a revision worth writing about, or an unexpected story out of Seattle can just as easily add a post that isn’t on this list. Expect the week to look roughly like this, and expect at least one day of it not to.
The week of August 17–21 on seattletrendlines.com, in 9 posts.
Monday, August 17 — Seattle Fire overdose responses, July 2026. Seattle Fire was dispatched to 98 overdose calls in July 2026, down 46.7% from a year earlier. Over the life of the series the monthly count has run between 68 (August 2022) and 233 (October 2023).
Monday, August 17 — Battery or hybrid: Washington’s EV mix, July 2026. Washington had 235,196 battery-electric vehicles registered in July 2026, up 15.9% on the year, and 57,080 plug-in hybrids, up 8.3%. Pure battery cars are 80% of the state’s plug-in fleet.
Tuesday, August 18 — Seattle gas prices in real terms, July 2026. A gallon of regular cost $5.24 at the Seattle pump in July 2026. The series is deflated to the latest month, so that is also this month’s figure in today’s money; what moves is what the old prices are worth.
Tuesday, August 18 — What the Seattle metro economy is worth, 2023. Everything produced in the three-county Seattle metro came to $567 billion in 2023, up 9.8% on the year. That is 256% more than the $159 billion the same three counties produced in 2001.
Wednesday, August 19 — The crime category that isn’t one, June 2026. Seattle police filed 257 offenses under the category ANY in June 2026 — neither a crime against a person, nor against property, nor against society, which are the three NIBRS is supposed to sort every offense into.
Wednesday, August 19 — Seattle inflation against the country, June 2026. Prices in the Seattle metro were 4.5% higher than a year earlier in June 2026. Nationally the figure was 3.4% — a gap of 1.2 points, with Seattle running hotter.
Thursday, August 20 — What King County sellers put up, July 2026. King County sellers listed 2,940 homes in July 2026, up 5.4% from a year earlier. The series has run from 672 in December 2022 to 4,684 in May 2019.
Thursday, August 20 — Washington jobless claims, week of Aug 8, 2026. Washington workers filed 5,307 initial unemployment claims in the week ending Aug 8, 2026; the steadier four-week average is 4,749, down 5.9% from a year ago.
Friday, August 21 — What King County sellers are asking, July 2026. The median King County home was listed at $850,000 in July 2026, down 2.7% from a year earlier. The series high is $949,248 (May 2022); the low is $550,000 (December 2016).
The week in review: every post from August 17–21, summarised from its own listing blurb and linked. Assembled each Saturday from the posts that actually published that week.
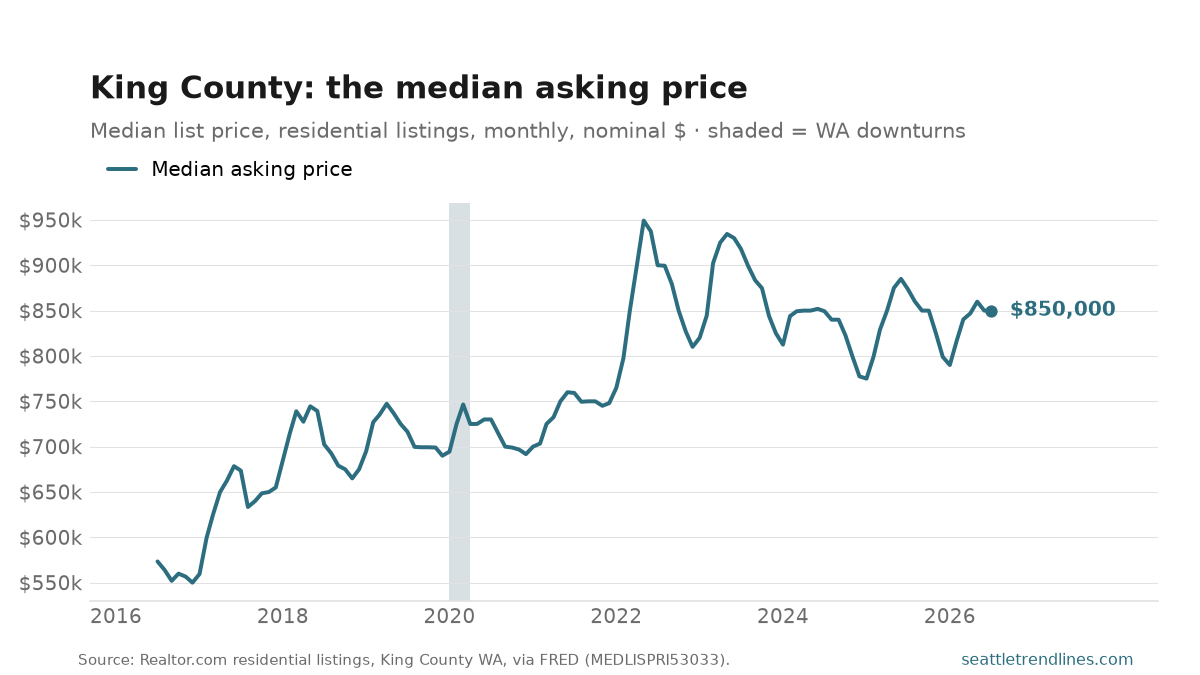
The median King County home was listed at $850,000 in July 2026, down 2.7% from a year earlier. The series high is $949,248 (May 2022); the low is $550,000 (December 2016).
This is what sellers want, which is a different and less careful number than what buyers pay. It moves with the mix of what happens to be on the market — a spring full of Eastside houses lifts it without any individual home getting more expensive — which is exactly the problem Case-Shiller is built to avoid by tracking repeat sales of the same properties. Read this one for the asking mood and that one for the price level.
What it has going for it is speed: an asking price exists the day the sign goes up, while Case-Shiller is a three-month average published two months late. Nominal dollars, not seasonally adjusted.
Source: Realtor.com residential listings, King County WA (FIPS 53033), via FRED MEDLISPRI53033. Nominal dollars. Auto-generated each build.
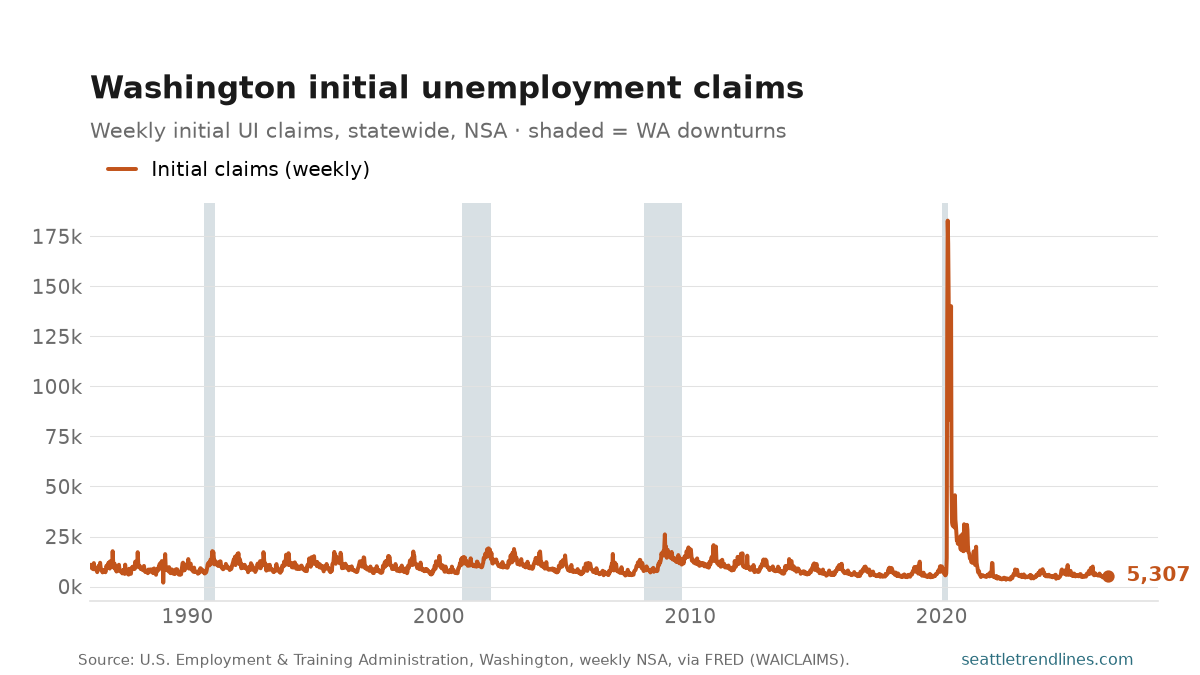
Washington workers filed 5,307 initial unemployment claims in the week ending Aug 8, 2026; the steadier four-week average is 4,749, down 5.9% from a year ago. Statewide, weekly, not seasonally adjusted — the update to the jobless-claims post.
Source: U.S. Employment and Training Administration, initial unemployment-insurance claims for Washington, weekly, not seasonally adjusted, via FRED WAICLAIMS. Auto-generated each build.
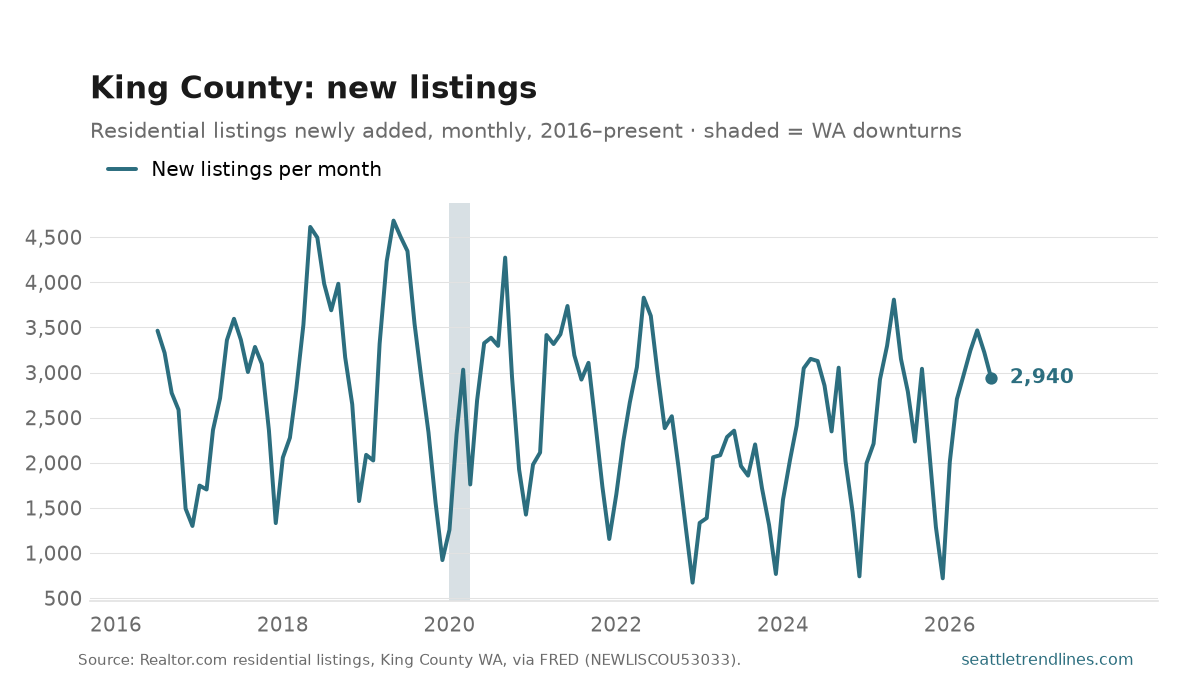
King County sellers listed 2,940 homes in July 2026, up 5.4% from a year earlier. The series has run from 672 in December 2022 to 4,684 in May 2019.
New listings are the supply side of the inventory number, and they are the half that says something about behaviour. Active inventory is a stock — what is sitting there — and it can rise either because more people are selling or because fewer people are buying. New listings are a flow, and only sellers control it. When the two diverge, the story is demand.
The sawtooth is severe here and it is not noise: listing a house is a spring activity in this market, so the year-over-year comparison is the only one that means anything. Nothing here is seasonally adjusted.
Source: Realtor.com residential listings, King County WA (FIPS 53033), via FRED NEWLISCOU53033. Auto-generated each build.
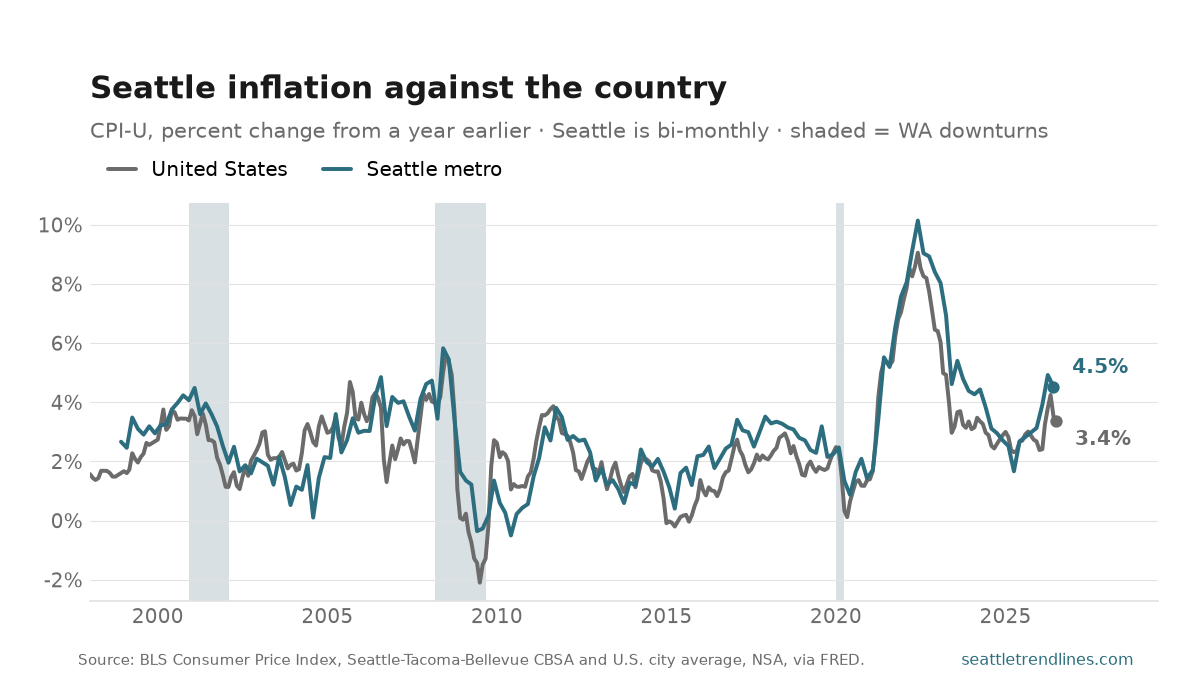
Prices in the Seattle metro were 4.5% higher than a year earlier in June 2026. Nationally the figure was 3.4% — a gap of 1.2 points, with Seattle running hotter.
The two lines mostly move together, because most of what drives inflation is national — energy, cars, the money supply. What separates them is housing. Shelter is roughly a third of the basket, it is the most local component in it, and Seattle’s has spent most of the last fifteen years rising faster than the country’s. When this region runs ahead of the national rate, that is usually what you are looking at, which is why asking rents lead this series by about a year.
Since 1998 Seattle’s rate has ranged from -0.5% (June 2010) to 10.1% (June 2022), which is the span this chart covers. One mechanical caveat: BLS publishes the Seattle index every other month, while the national one is monthly, so the local line has half as many points and the freshest national reading may be a month newer than the freshest local one.
Source: U.S. Bureau of Labor Statistics, Consumer Price Index for All Urban Consumers, Seattle–Tacoma–Bellevue CBSA (published bi-monthly) and the U.S. city average, not seasonally adjusted, via FRED. Auto-generated each build.
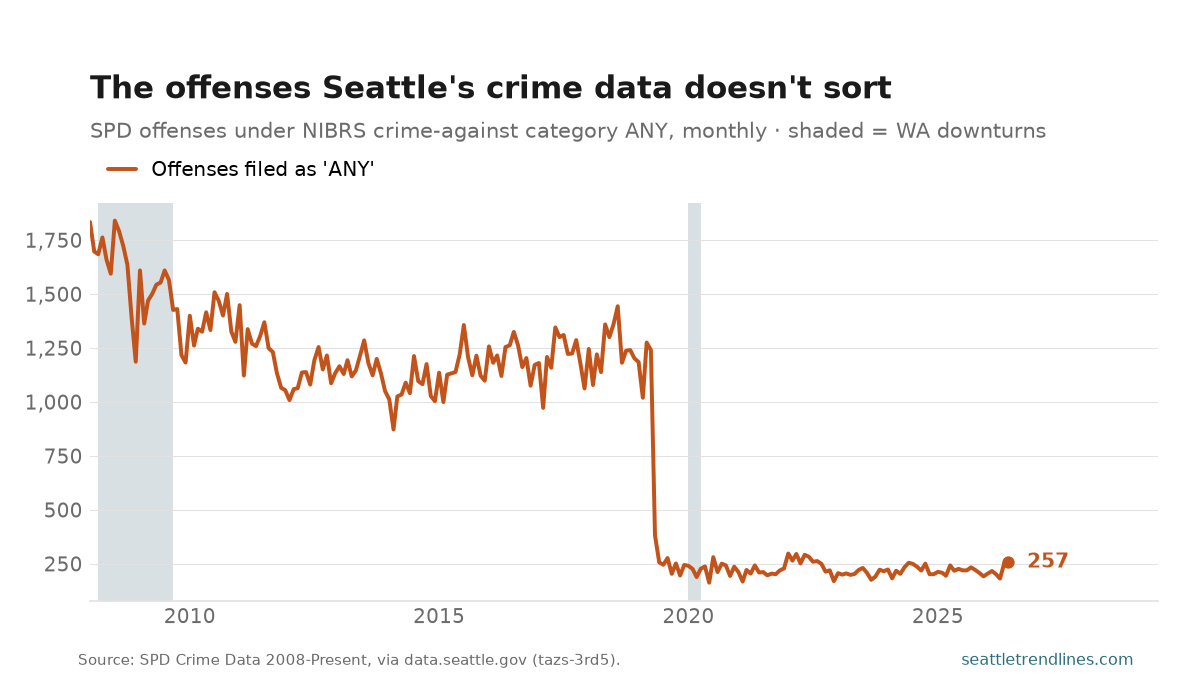
Seattle police filed 257 offenses under the category ANY in June 2026 — neither a crime against a person, nor against property, nor against society, which are the three NIBRS is supposed to sort every offense into. That is 4.5% of the 5,748 offenses in the month’s total. In January 2008, where the record starts, the same category carried 1,834 offenses — 26% of that month.
The fall between those two numbers is not a change in crime, and this is the one thing the chart is for: SPD migrated to a new records system in 2019, and the uncategorised residue collapsed with it. Nothing was solved and nothing stopped happening — the same offenses started arriving with a category attached. It is the clearest picture on this site of why the crime posts say not to read a trend across 2019.
The bucket is counted, not dropped: across the whole record it is about an eighth of all offenses, and a fifth of them in the early years, so throwing it away would quietly cut the headline. It goes into the total here and in SPD’s. Offenses are dated by when the offense started rather than when the report was written, so the newest month in the file is always a little short and revises up.
Source: Seattle Police Department, SPD Crime Data 2008-Present, via data.seattle.gov (Socrata tazs-3rd5), offenses whose nibrs_crime_against_category reads ANY, dated by offense date. Counts crime reported to police. Bench post — generated from the latest observation in the site database.