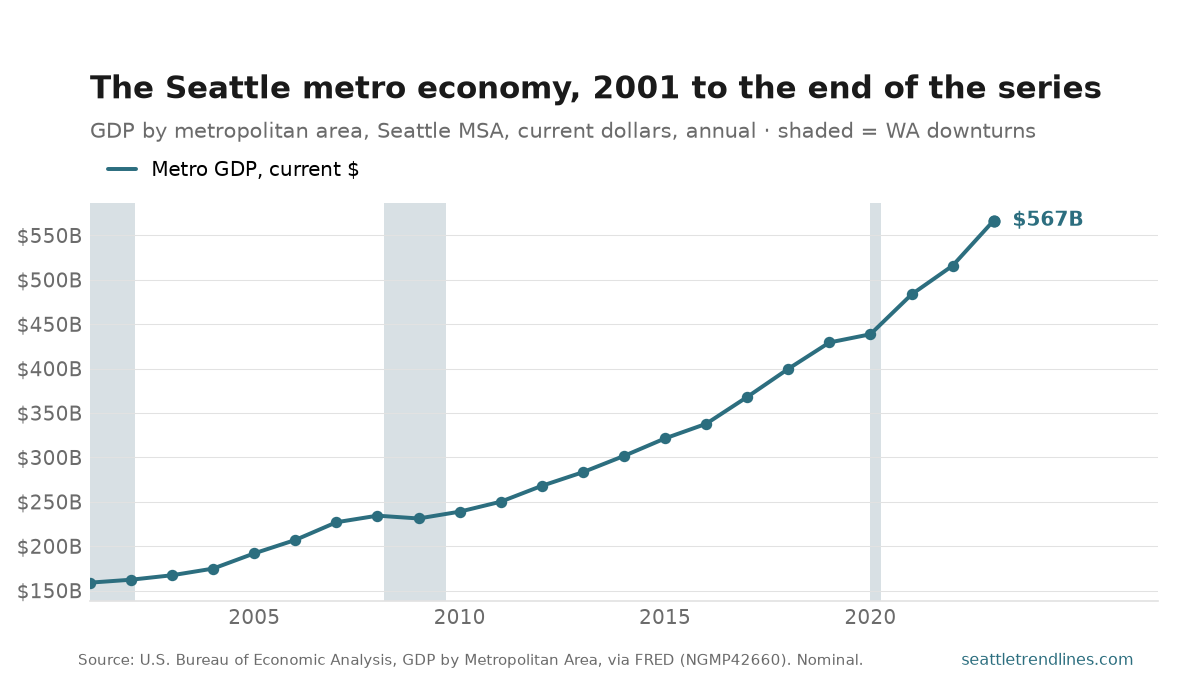
Everything produced in the three-county Seattle metro came to $567 billion in 2023, up 9.8% on the year. That is 256% more than the $159 billion the same three counties produced in 2001.
These are current dollars, not inflation-adjusted ones, so a good part of that climb is the dollar getting smaller rather than the region making more — the same caveat the gas-price post turns on. What the nominal line does show cleanly is where output actually stopped: one down year, in 2009, and a 2020 that barely moved. Seattle’s pandemic year cost the region a year of growth, not the level itself.
The geography is the Seattle–Tacoma–Bellevue MSA — King, Snohomish and Pierce counties, the same three the payroll series covers — so this is the regional economy, not the city’s. It also stops: BEA discontinued the metro-level series, which is why the line ends where it does and why there is no monthly update post behind it.
Source: U.S. Bureau of Economic Analysis, GDP by Metropolitan Area, all-industry total for the Seattle–Tacoma–Bellevue WA MSA (CBSA 42660), via FRED NGMP42660, millions of current dollars. BEA has discontinued the metro-level series; 2023 is the final official year. Bench post — generated from the latest observation in the site database.
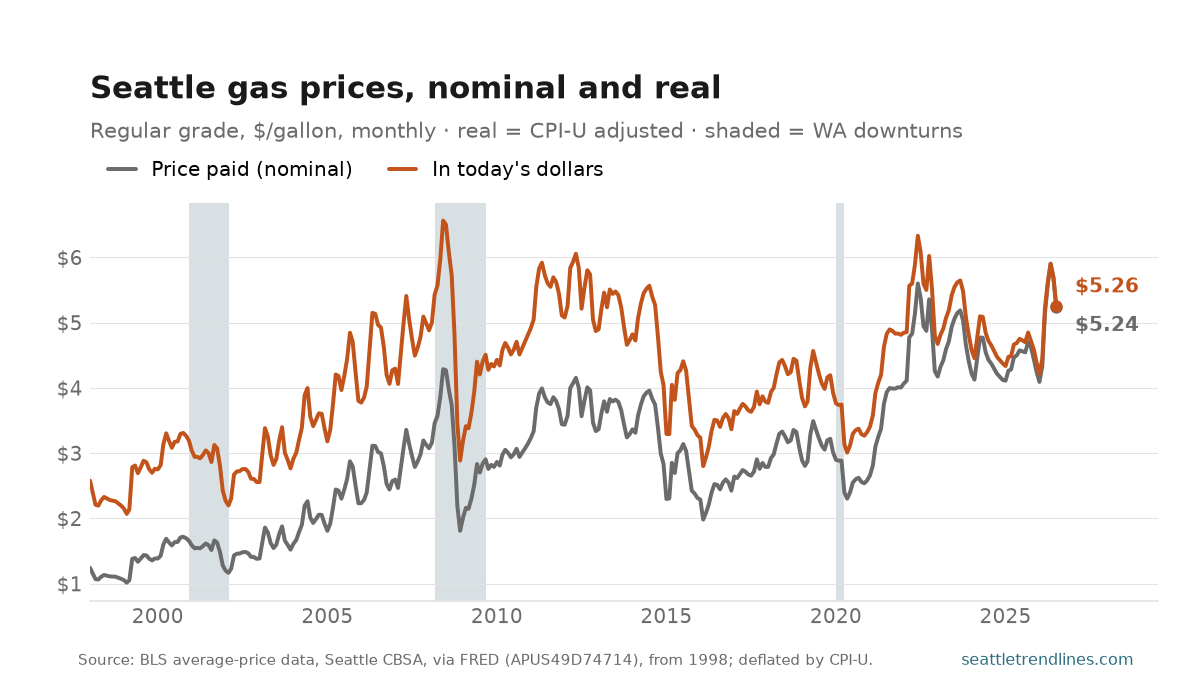
A gallon of regular cost $5.24 at the Seattle pump in July 2026. The series is deflated to the latest month, so that is also this month’s figure in today’s money; what moves is what the old prices are worth. A year ago’s gallon comes to $4.73 in today’s dollars, which puts this month up 11.1% in real terms.
The gap between the two lines is the whole post. The nominal line keeps setting records because dollars keep getting smaller; the real line says whether a tank of gas is actually taking more out of a Seattle paycheck than it used to. Measured that way the record is $6.56, set in June 2008 — today’s price is 20% below it. The cheapest gas of the series, in the same money, was $2.07 in February 1999. The record-at-the-pump post made that comparison at May’s high; this is the same pair of lines a couple of releases on.
Deflated with the CPI-U, so “today’s dollars” means the latest period the price index covers. Prices are a monthly average for the Seattle CBSA, not a spot price at any one station, and Washington’s fuel taxes and its clean-fuel standard are inside the number — this is what people paid, not what the crude cost.
One gap in the record: BLS collected this price for Seattle from 1978, stopped in the late 1980s, and only resumed in January 1998. The chart starts where the series resumes rather than drawing a straight line across the missing decade.
Source: U.S. Bureau of Labor Statistics average-price series, regular unleaded gasoline, Seattle CBSA, via FRED APUS49D74714, drawn from the January 1998 resumption — BLS published no Seattle price between the late 1980s and then. Real series deflated by CPI-U to the latest available period. Auto-generated each build.
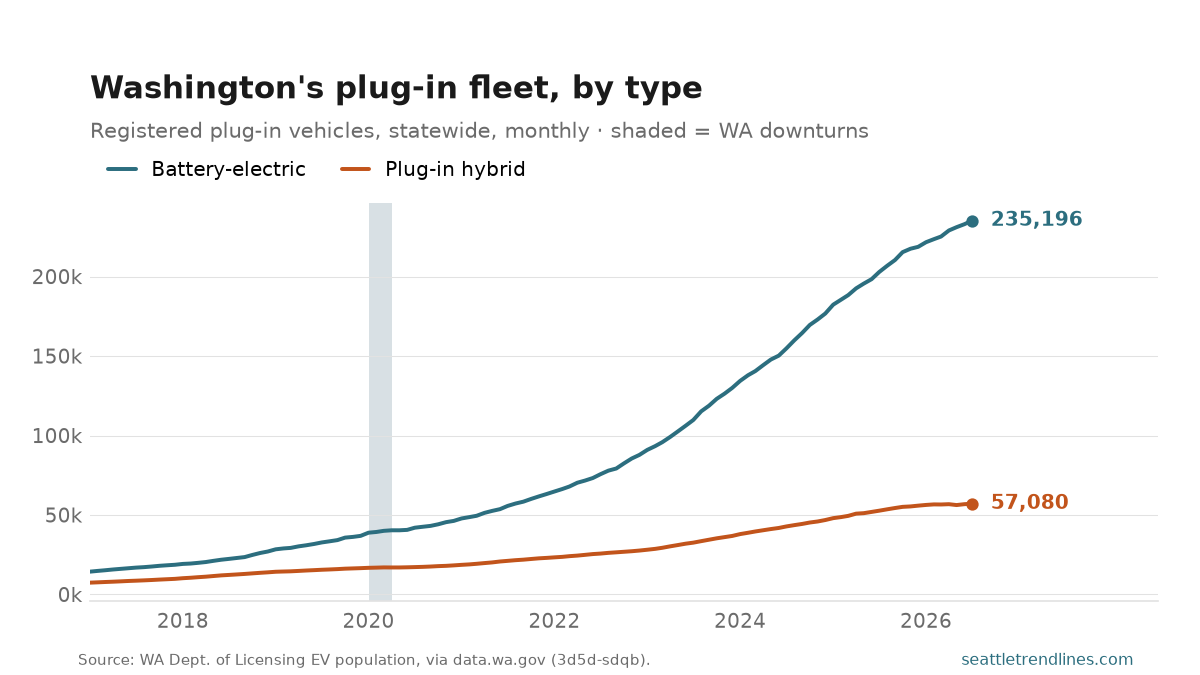
Washington had 235,196 battery-electric vehicles registered in July 2026, up 15.9% on the year, and 57,080 plug-in hybrids, up 8.3%. Pure battery cars are 80% of the state’s plug-in fleet.
The EV post charts those two added together. Split apart they answer a question the total can’t: whether the plug-in hybrid — a car with a cord and a petrol engine, sold for a decade as the bridge to the electric one — turned out to be a bridge or a dead end. The two slopes are not close, and they have not been converging.
Registrations in force, not sales: a stock that grows with purchases and shrinks as cars leave the road or the state, so a month that dips is not a month nobody bought one. Counted at the owner’s registration address.
Source: Washington State Department of Licensing, Electric Vehicle Population Size History By County, via data.wa.gov 3d5d-sdqb, statewide registrations in force. Bench post — generated from the latest observation in the site database.
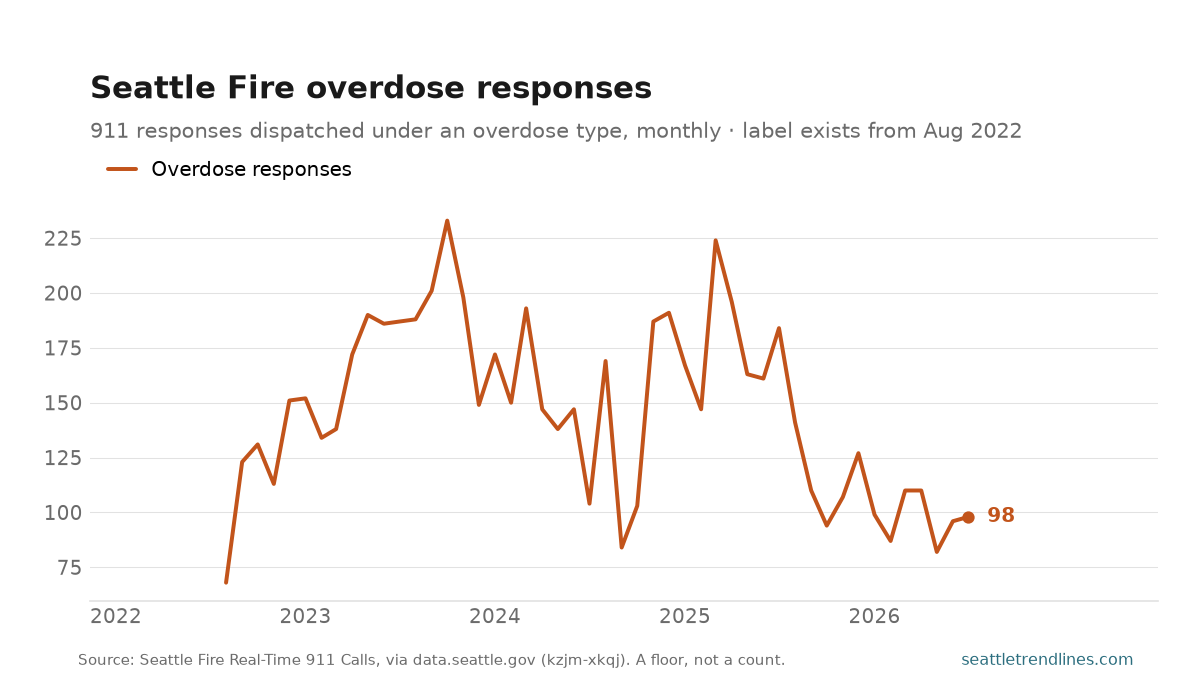
Seattle Fire was dispatched to 98 overdose calls in July 2026, down 46.7% from a year earlier. Over the life of the series the monthly count has run between 68 (August 2022) and 233 (October 2023).
This is the timely companion to the overdose death count, and it is a different measurement in every respect. Deaths are certified by the Medical Examiner and arrive as an annual figure a year late; these are dispatches, and they land the same day. Most of them are survivals — a response is a call for help, and the great majority of people the medics reach do not die. So the two lines answer different questions: one counts the worst outcome, this one counts how often the emergency happens at all.
Two limits, and both matter. The chart starts in August 2022 because that is when an overdose dispatch type first appears in the feed — the flat run of zeros before it is a missing label, not a city without overdoses, and it is why there is no pre-fentanyl baseline here to compare against. And the cut is a substring match on free text, which the department writes inconsistently (‘Medic Response-Overdose’, ‘BC Med Response Overdose’), so it is a floor: an overdose dispatched as an unconscious person, or a cardiac arrest, is not in it.
Source: Seattle Fire Department, Real-Time 911 Calls, via data.seattle.gov (Socrata kzjm-xkqj), responses whose free-text dispatch type contains OVERDOSE. A floor on overdose responses rather than an exact count. Auto-generated each build.
What’s coming on seattletrendlines.com the week of August 17–21 — 10 posts, two a day, every weekday.
Monday, August 17 — Battery or hybrid: Washington’s EV mix, July 2026; Seattle Fire overdose responses, July 2026.
Tuesday, August 18 — What the Seattle metro economy is worth, 2023; Seattle gas prices in real terms, July 2026.
Wednesday, August 19 — The crime category that isn’t one, June 2026; Seattle inflation against the country, June 2026.
Thursday, August 20 — Washington jobless claims, week of Aug 8, 2026; What King County sellers put up, July 2026.
Friday, August 21 — What King County sellers are asking, July 2026; Primary election turnout, King County (pending — its numbers haven’t landed yet).
This is the plan, not a promise. Every weekday post here is tied to a data release, and a release that slips takes its post with it — the post simply waits for the day its numbers land. A figure that arrives early, a revision worth writing about, or an unexpected story out of Seattle can just as easily add a post that isn’t on this list. Expect the week to look roughly like this, and expect at least one day of it not to.
The week of August 10–14 on seattletrendlines.com, in 7 posts.
Tuesday, August 11 — How long a King County listing sits, July 2026. The median King County listing sat 44 days on the market in July 2026, up 2 days from a year earlier.
Tuesday, August 11 — The shrinking factory floor, June 2026. Seattle-metro factories employed 166,700 people in June 2026, up 2.0% from a year earlier. The high-water mark was 246,000 in June 1998 — this region now has 79,800 fewer manufacturing jobs than it did then, a fall of 32%.
Wednesday, August 12 — The construction cycle, June 2026. The Seattle metro’s construction trades employed 121,900 people in June 2026, down 1.1% from a year earlier.
Wednesday, August 12 — Washington business applications, June 2026. Washingtonians filed 9,333 new business applications in June 2026, up 9.0% from a year earlier.
Thursday, August 13 — Restaurants, hotels and the long climb back, June 2026. Seattle-metro restaurants, bars, hotels and venues employed 212,600 people in June 2026, up 1.4% from a year earlier.
Thursday, August 13 — The permit numbers nobody should read, June 2026. The Seattle metro permitted 1,947 housing units in June 2026, against 2,263 the month before. Do not read anything into that.
Friday, August 14 — What a Seattle dollar is worth, April 2026. The Seattle-area consumer price index stood at 377.1 in April 2026. The index itself is not the interesting number — what it means is.
The week in review: every post from August 10–14, summarised from its own listing blurb and linked. Assembled each Saturday from the posts that actually published that week.
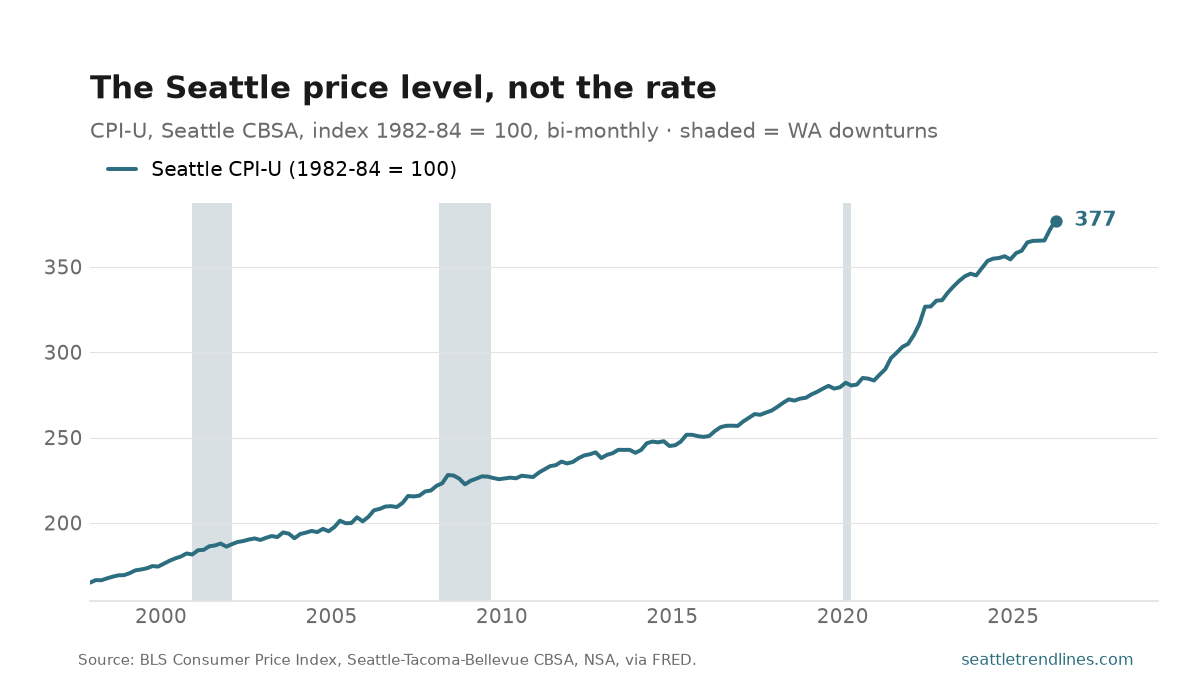
The Seattle-area consumer price index stood at 377.1 in April 2026. The index itself is not the interesting number — what it means is. Prices in this metro are 2.29 times what they were in December 1997, which is the same as saying that $2.29 today buys what $1 bought then.
Turn it around and it is starker: a dollar saved in December 1997 and left in a drawer is worth 44 cents now. That is not a Seattle failing — it is what an economy with positive inflation does, by design — but the cumulative version is rarely shown, because the news always reports the rate.
The rate is the slope of this line, and it is the subject of Seattle inflation against the country. A falling rate still means this line is going up, just less steeply — prices coming back down would be a line that turns, and it never has. Index base 1982-84 = 100, published bi-monthly for this metro.
Source: U.S. Bureau of Labor Statistics, Consumer Price Index for All Urban Consumers, Seattle–Tacoma–Bellevue CBSA, all items, not seasonally adjusted, index 1982-84 = 100, via FRED. Bench post — generated from the latest observation in the site database.
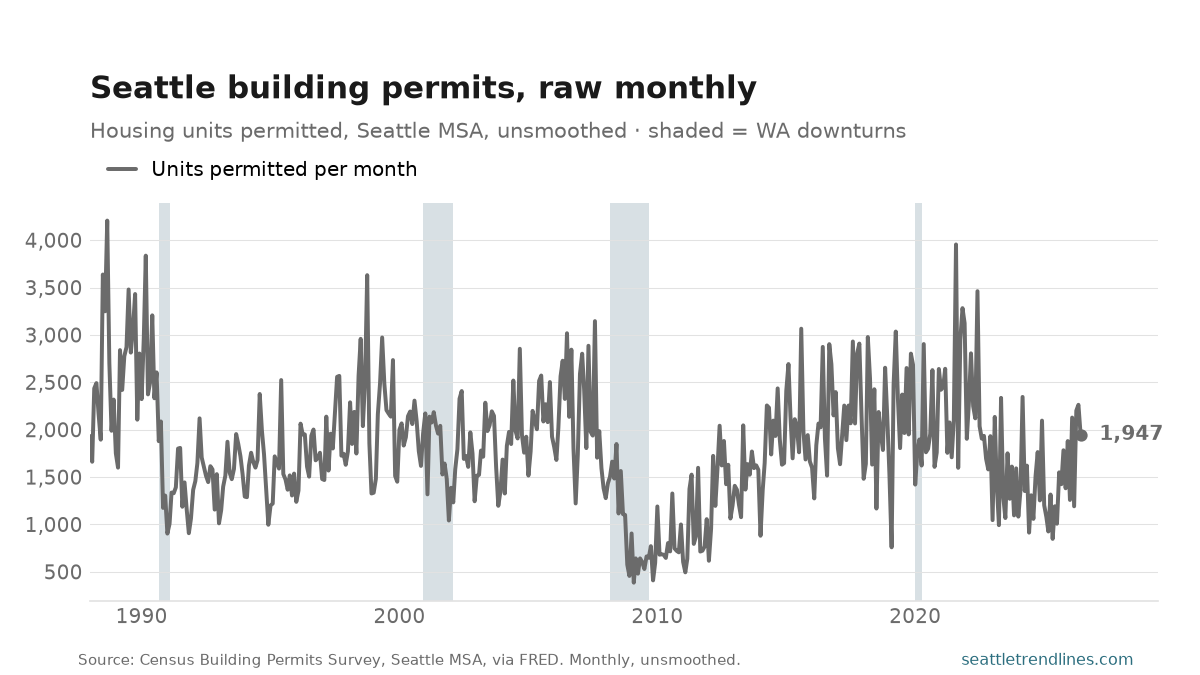
The Seattle metro permitted 1,947 housing units in June 2026, against 2,263 the month before. Do not read anything into that.
This is the raw monthly permit count, and it is here as a demonstration rather than as news. The series swings between 386 units (February 2009) and 4,207 (September 1988), and month-to-month moves of a third in either direction are routine — one 300-unit apartment building crossing a desk on the 31st rather than the 1st shows up here as a boom or a collapse. A single large project can be most of a month’s number.
That is why every permit post on this site charts the trailing 12-month sum instead: the permit slump is the same data with a year of it added up, and it has a shape you can actually read. The smoothing is not a cosmetic choice. It is the difference between a series that means something and this one.
Source: U.S. Census Bureau Building Permits Survey, Seattle–Tacoma–Bellevue MSA, housing units permitted per month, not smoothed and not seasonally adjusted, via FRED. Bench post — generated from the latest observation in the site database.
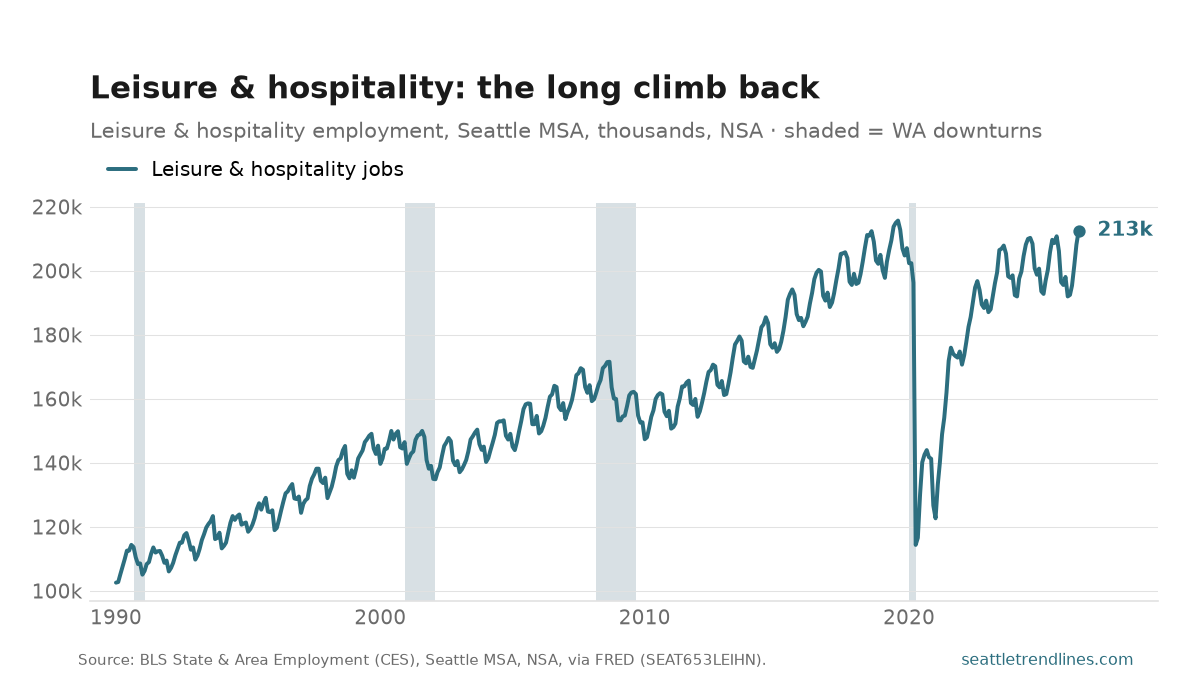
Seattle-metro restaurants, bars, hotels and venues employed 212,600 people in June 2026, up 1.4% from a year earlier. No sector in this data fell as far or as fast in 2020 — more than 40% of these jobs went between February and April of that year — and the record is still the 216,000 of August 2019, with the sector 1.4% below it today. It also has the largest seasonal swing of any sector in the region, which is why the year-over-year comparison is the one to read — this data is not seasonally adjusted.
Source: U.S. Bureau of Labor Statistics, State & Area Employment (CES), Seattle–Tacoma–Bellevue MSA, leisure & hospitality, not seasonally adjusted, via FRED SEAT653LEIHN. Bench post — generated from the latest observation in the site database.
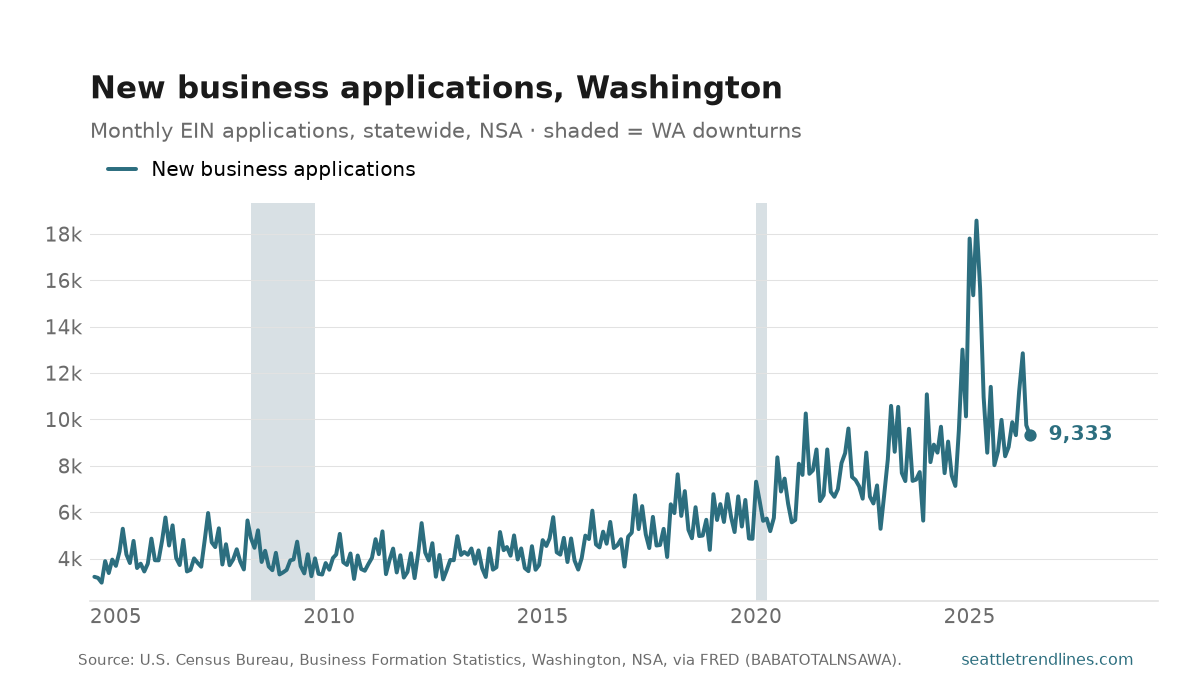
Washingtonians filed 9,333 new business applications in June 2026, up 9.0% from a year earlier. These are EIN filings, so the series measures intent to start a business rather than businesses that actually open — but it lands about 11 days after the month ends, which makes it one of the fastest real-activity readings available for the state. Note the step-change after 2020: application rates never returned to their pre-pandemic level.
Source: U.S. Census Bureau, Business Formation Statistics, business applications for Washington, monthly, not seasonally adjusted, via FRED BABATOTALNSAWA. Auto-generated each build.