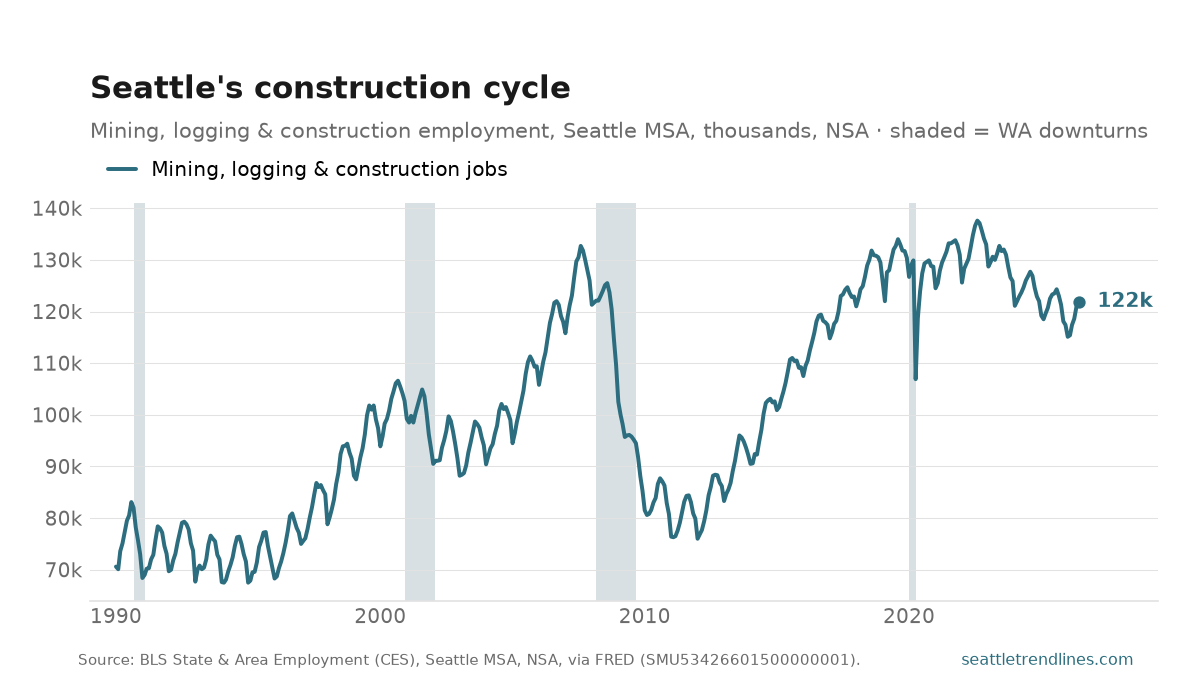
The Seattle metro’s construction trades employed 121,900 people in June 2026, down 1.1% from a year earlier. Construction is the most cyclical employer in the region — it shed more than 40% of these jobs between the 2007 peak and the 2012 bottom — so it reads as an early warning on the rest of the economy. Set it against the permit slump: permits are what gets started, and this is who is left to build it. (FRED publishes mining, logging and construction as one series for this metro; in Seattle it is construction almost end to end.)
Source: U.S. Bureau of Labor Statistics, State & Area Employment (CES), Seattle–Tacoma–Bellevue MSA, mining/logging/construction, not seasonally adjusted, via FRED SMU53426601500000001. Bench post — generated from the latest observation in the site database.
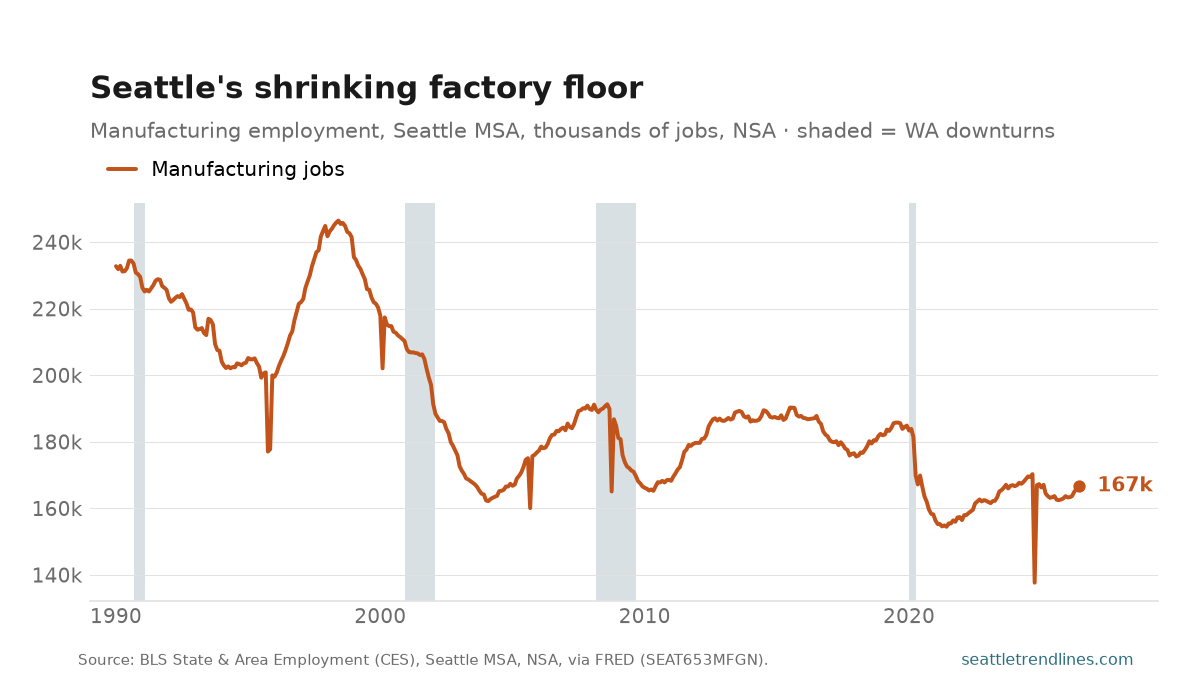
Seattle-metro factories employed 166,700 people in June 2026, up 2.0% from a year earlier. The high-water mark was 246,000 in June 1998 — this region now has 79,800 fewer manufacturing jobs than it did then, a fall of 32%. Manufacturing here is mostly one company’s supply chain, which is why the series has vertical notches a normal industry series doesn’t: those are Boeing machinist strikes, visible because the data is not seasonally adjusted. It is the other half of tech versus aerospace.
Source: U.S. Bureau of Labor Statistics, State & Area Employment (CES), Seattle–Tacoma–Bellevue MSA, manufacturing, not seasonally adjusted, via FRED SEAT653MFGN. Bench post — generated from the latest observation in the site database.
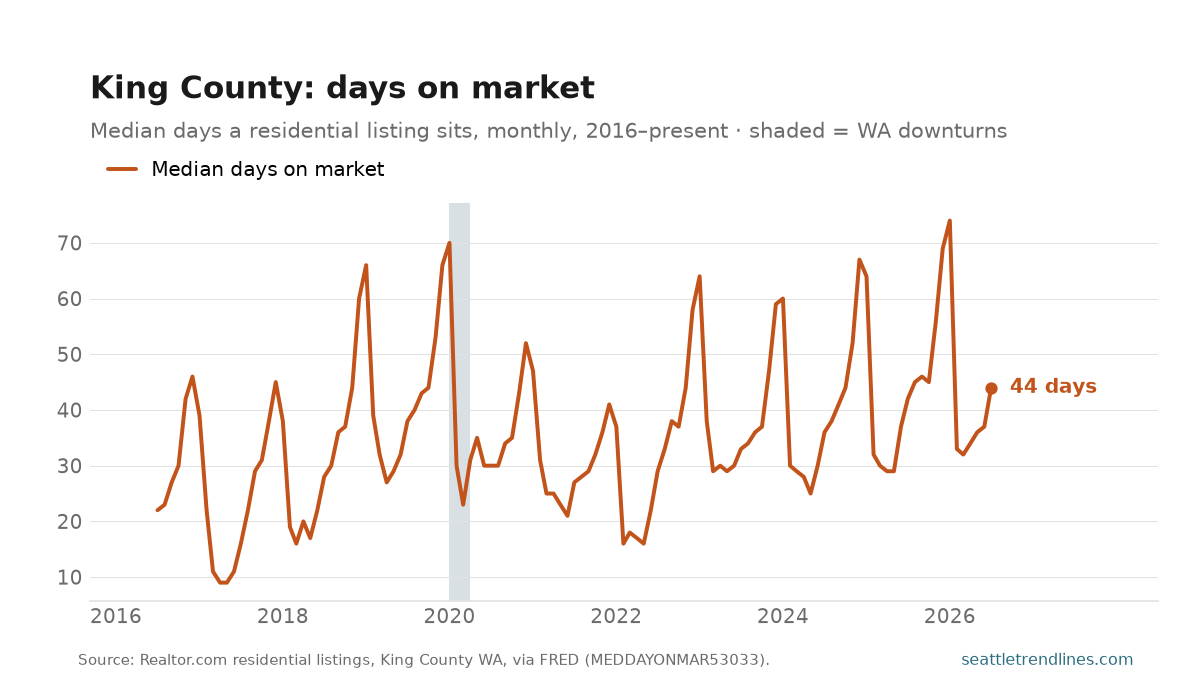
The median King County listing sat 44 days on the market in July 2026, up 2 days from a year earlier. The series ranges from 9 days at its fastest (April 2017) to 74 at its slowest (January 2026), and it saw-tooths hard every winter — so the year-over-year change is the comparison that means anything. Days on market is the cleanest read on whether buyers or sellers are setting the pace; inventory says how much there is to choose from.
Source: Realtor.com residential listings, King County WA (FIPS 53033), via FRED MEDDAYONMAR53033. Bench post — generated from the latest observation in the site database.
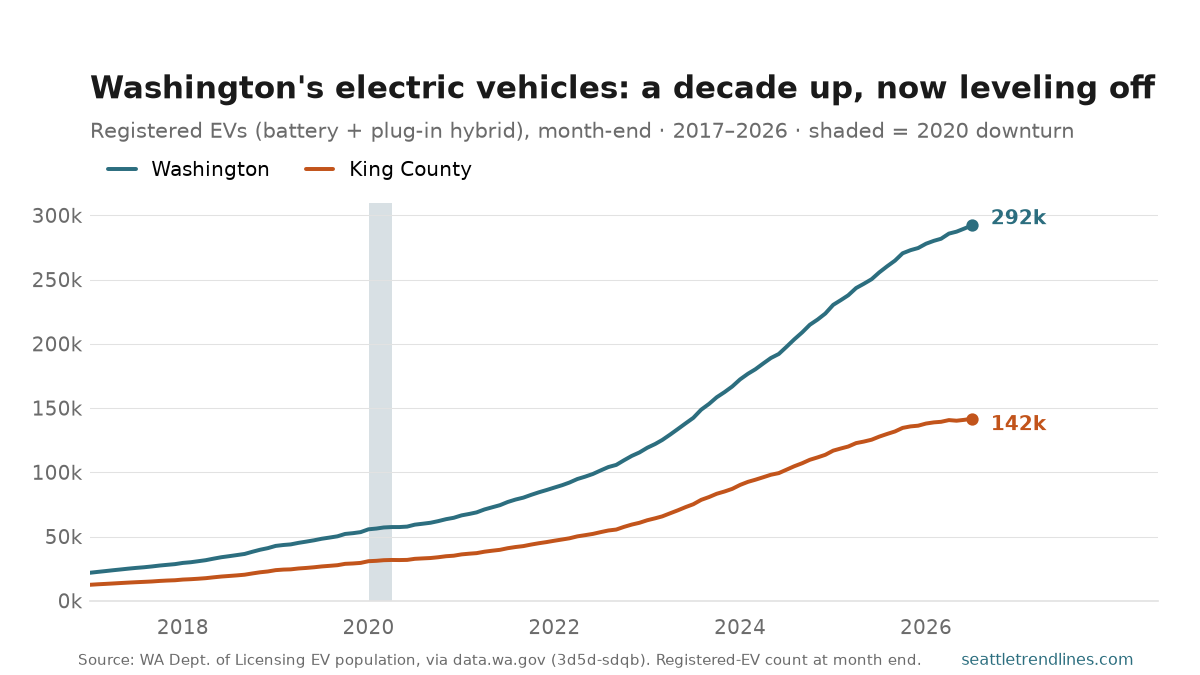
The Washington Department of Licensing keeps a running count of every electric vehicle registered in the state, and it makes for one of the cleanest adoption curves you’ll find: a physical count of cars on the road, not a survey or a projection. At the end of May 2026 there were about 280,000 registered EVs in Washington — battery-electric and plug-in hybrid combined — up from just 22,000 at the start of 2017. That’s nearly a 13-fold increase in nine years. King County holds about 136,000 of them, just under half the statewide fleet, which tracks its share of the state’s wealth, its charging density, and its politics.
The news in this update is the shape of the last year. For most of the decade the line bent upward — each year’s gain bigger than the last. That has stopped. Growth has decelerated sharply, and in May 2026 the statewide fleet actually dipped for the first time in the series’ history outside the 2020 shutdown, slipping about 1,200 vehicles from its April peak. Year-over-year the numbers are still positive — +13.5% statewide, +10.2% in King County — but the monthly pace that produced those gains has largely evaporated. One month doesn’t make a trend, and a registration count can be revised, so the honest read is “flattening, watch it,” not “falling.” But the flattening is real and it is recent.
Underneath the total, the plug-in hybrid is fading. Battery-electric vehicles are now about 80% of the fleet (roughly 225,000) and still creeping up; plug-in hybrids (about 54,000) peaked in early 2026 and have been shrinking since. So the plateau in the headline number is really two stories at once — battery-electric growth cooling, and plug-in hybrids in outright decline — converging into a curve that, for the first time since these cars showed up in Washington, has stopped bending toward the sky.
Source: Washington State Department of Licensing, Electric Vehicle Population, via data.wa.gov (dataset 3d5d-sdqb). Count of EVs registered in Washington at each month-end (filtered to registration state = WA; King County is the county cut). Battery-electric + plug-in hybrid. Data refreshes monthly on the next daily build. State downturn shaded from FRED WAPHCI.
What’s coming on seattletrendlines.com the week of August 10–14 — 8 posts on the calendar.
Monday, August 10 — Washington’s EV fleet: a decade of fast growth, now flattening.
Tuesday, August 11 — How long a King County listing sits, July 2026; The shrinking factory floor, June 2026.
Wednesday, August 12 — The construction cycle, June 2026; Washington business applications, June 2026.
Thursday, August 13 — Restaurants, hotels and the long climb back, June 2026; The permit numbers nobody should read, June 2026.
Friday, August 14 — What a Seattle dollar is worth, April 2026.
This is the plan, not a promise. Every weekday post here is tied to a data release, and a release that slips takes its post with it — the post simply waits for the day its numbers land. A figure that arrives early, a revision worth writing about, or an unexpected story out of Seattle can just as easily add a post that isn’t on this list. Expect the week to look roughly like this, and expect at least one day of it not to.
The week of August 3–7 on seattletrendlines.com, in five posts.
Monday, August 3 — Lake Washington sockeye: the run that no longer runs. Sockeye salmon have been counted at the Ballard Locks every year since 1972. Runs that once topped half a million fish have collapsed: just 17,881 crossed in 2025, and the run hasn’t cleared the 350,000 needed to open a fishery since 2006.
Tuesday, August 4 — Seattle-metro unemployment, June 2026. Seattle-metro unemployment was 5.0% in June 2026, the newest month in the series and the monthly update to the unemployment post. That is up 0.3 points from 4.7% in the same month a year earlier, and up from 4.8% the month before.
Wednesday, August 5 — What a Seattle-area house is worth, June 2026. The typical Seattle-metro home was worth $729,403 in June 2026, down 1.8% from a year earlier. The index peaked at $769,953 in June 2022, so the market is still 5.3% below its high-water mark.
Thursday, August 6 — Seattle library checkouts, July 2026. Seattle Public Library patrons checked out 869,036 items in July 2026, up 5.7% from a year earlier.
Friday, August 7 — Seattle Fire 911 responses, July 2026. Seattle Fire dispatched 9,886 responses in July 2026, down 3.8% from a year earlier.
The week in review: every post from August 3–7, summarised from its own listing blurb and linked. Assembled each Saturday from the posts that actually published that week.
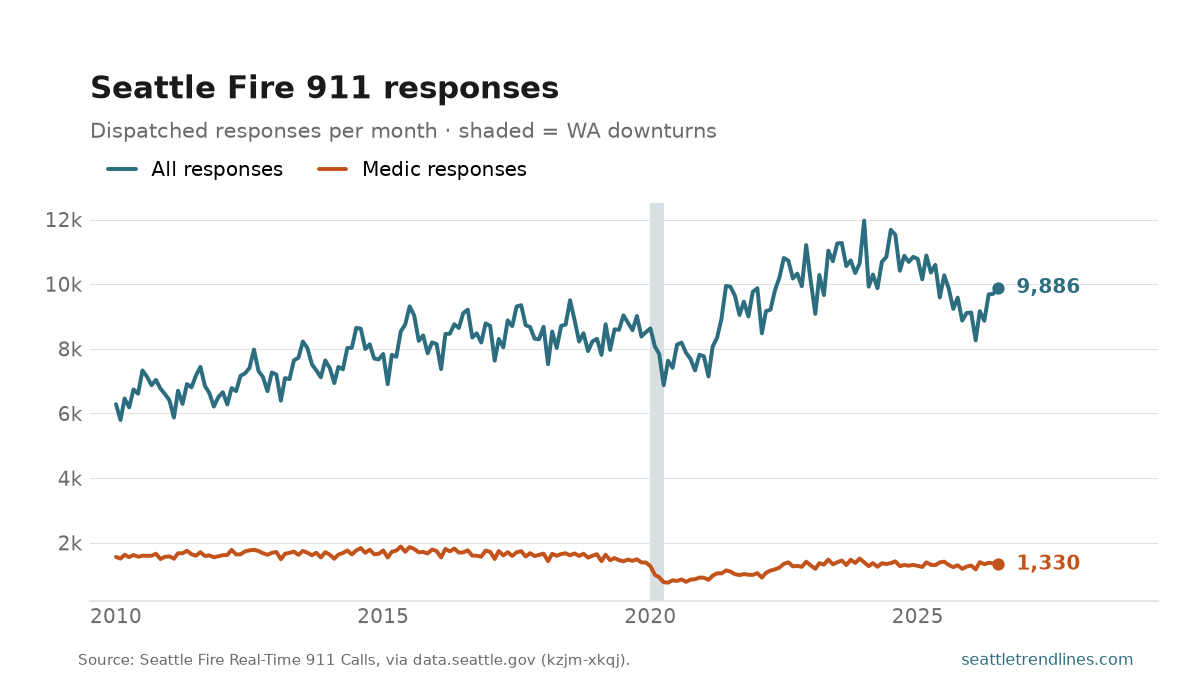
Seattle Fire dispatched 9,886 responses in July 2026, down 3.8% from a year earlier. Despite the name, this is mostly not a fire series: aid and medic calls are the large majority of the volume, which makes it a rough read on population and on medical distress rather than on fires.
It counts dispatched responses, not incidents or patients — one event can draw several units, so the line moves with deployment practice as well as with need.
Source: Seattle Fire Department, Real-Time 911 Calls, via data.seattle.gov (Socrata kzjm-xkqj). Auto-generated each build.
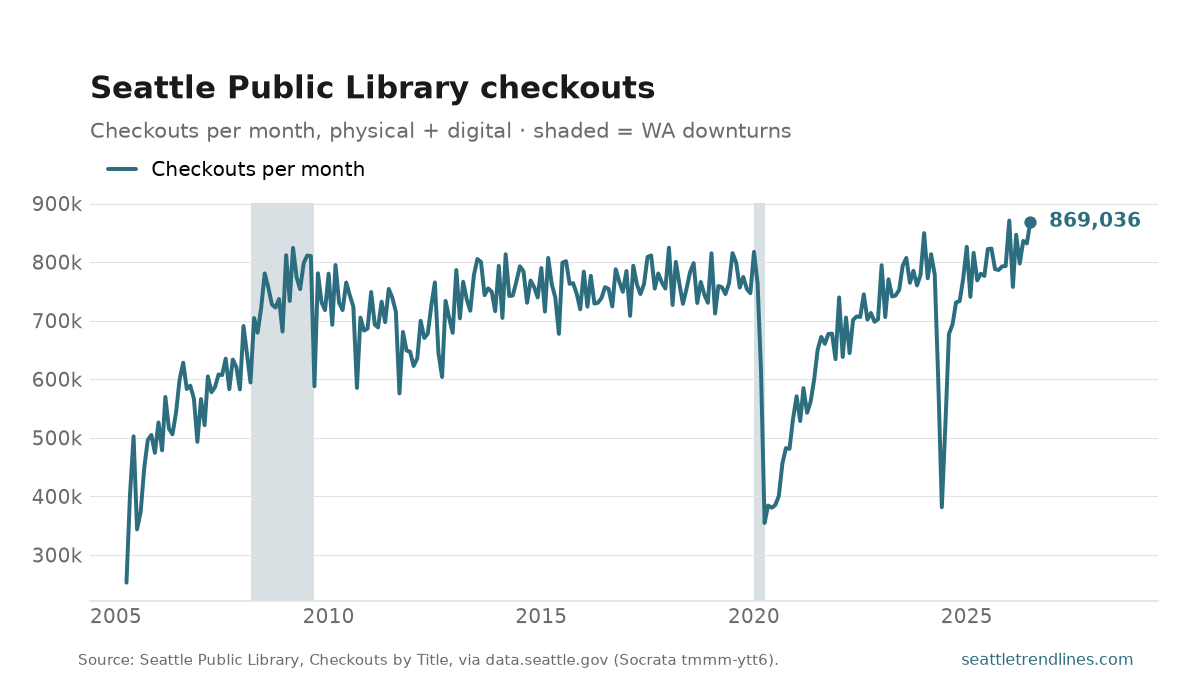
Seattle Public Library patrons checked out 869,036 items in July 2026, up 5.7% from a year earlier. The series counts checkout events rather than borrowers, and it runs back to 2005 — long enough to show the 2020 branch closures as the cliff they were. What came back afterward is not what left: the recovery is substantially digital, so the physical/digital mix on either side of 2020 is not the same library.
Corrected 2026-09-29: this post first reported 248,692 checkouts for July 2026, up 3.8% on the year. That figure counted the titles checked out, not the checkouts; each title can go out many times in a month. The chart and figures above are now total checkouts.
Source: Seattle Public Library, Checkouts by Title, via data.seattle.gov (Socrata tmmm-ytt6). Auto-generated each build.
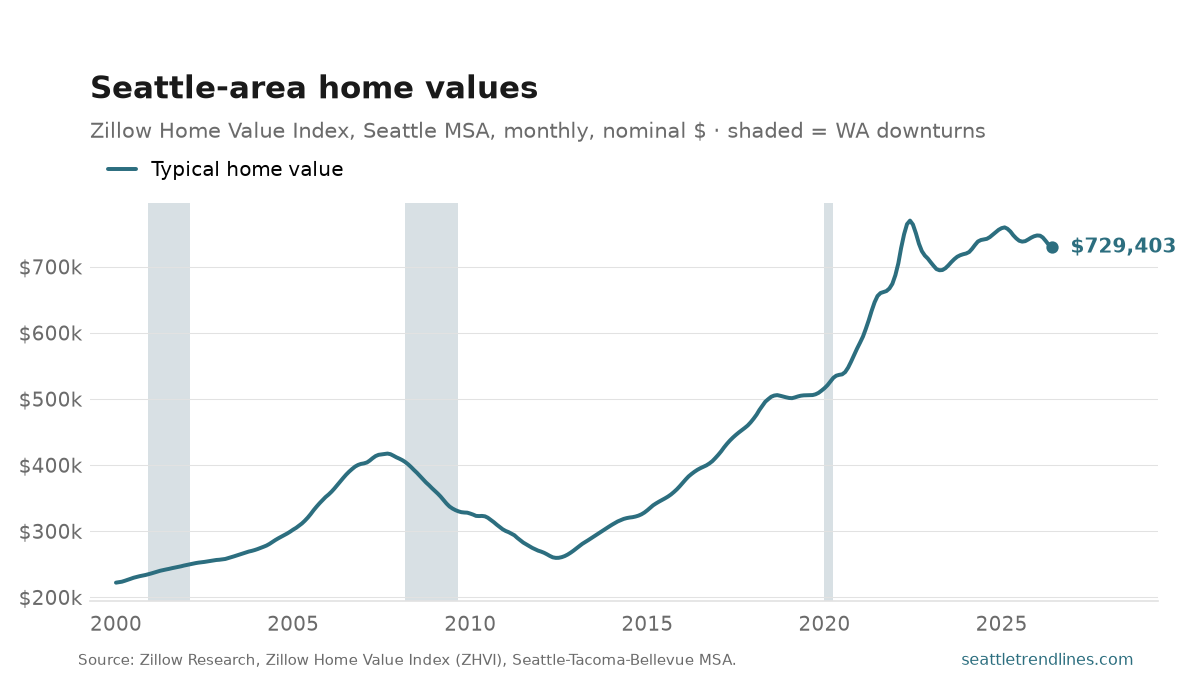
The typical Seattle-metro home was worth $729,403 in June 2026, down 1.8% from a year earlier. The index peaked at $769,953 in June 2022, so the market is still 5.3% below its high-water mark. ZHVI tracks the value of the typical home rather than the price of the homes that happened to sell, so it does not swing with the mix of what is on the market — which is what makes it readable month to month.
Source: Zillow Research, Zillow Home Value Index (ZHVI), all homes, Seattle–Tacoma–Bellevue MSA, nominal dollars. Bench post — generated from the latest observation in the site database.
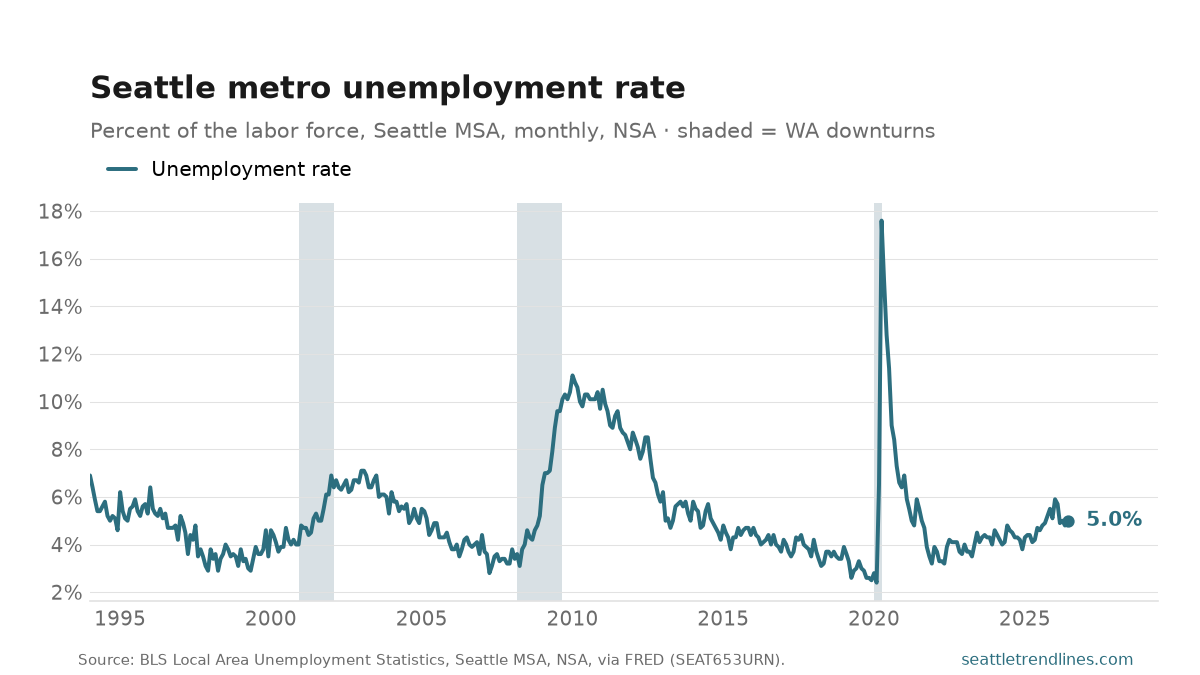
Seattle-metro unemployment was 5.0% in June 2026, the newest month in the series and the monthly update to the unemployment post. That is up 0.3 points from 4.7% in the same month a year earlier, and up from 4.8% the month before. The chart carries the full history back to 1994; the older post’s version of it stops at the month it was published with, so the two lines end in different places on purpose.
The year-ago comparison is the one to trust here. These numbers are not seasonally adjusted, so part of every month-to-month move is just the calendar — hiring for the holidays, students leaving and re-entering the labor force — and only the same month a year earlier strips that out. Keep the scale in mind too: this series ran from 2.4% in February 2020 to 17.6% in April 2020, so a few tenths of a point is a wobble, not a turn. And because the rate is a ratio, it can fall for the wrong reason — people who stop looking for work leave the denominator, and the rate improves with nobody hired.
Source: U.S. Bureau of Labor Statistics, Local Area Unemployment Statistics, Seattle–Tacoma–Bellevue MSA unemployment rate, not seasonally adjusted, via FRED SEAT653URN. Auto-generated each build.