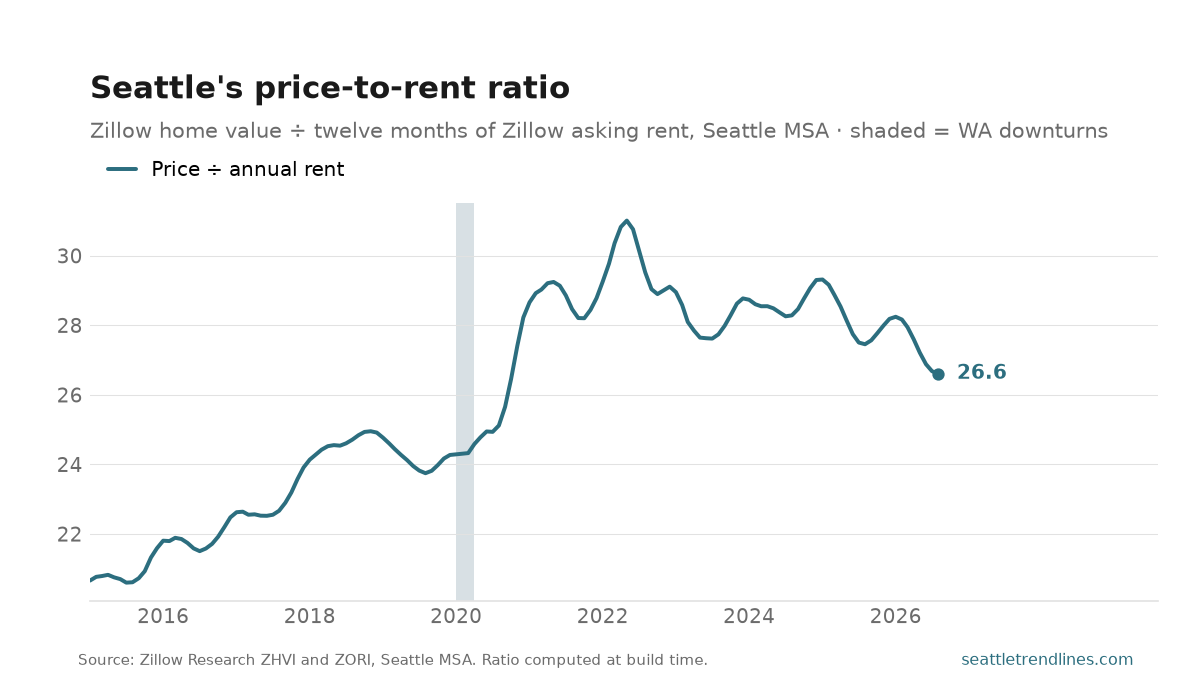
The typical Seattle-area home was worth $727,359 in August 2026, and the typical asking rent was $2,278 a month. Divide the first by a year of the second and you get the price-to-rent ratio: 26.6. A Seattle house costs about 27 years of the rent on it.
It is the cleanest single number for whether housing is expensive relative to itself. Prices and rents are both driven by local incomes and local supply, so when they rise together the ratio holds flat and the market is simply pricier; when prices pull away from rents, buyers are paying for something other than the shelter — expected appreciation, or cheap credit. Nationally a ratio in the high teens is typical. Seattle’s has run from 13.8 (January 2000) to 31.0 (May 2022), and it is 26.6 now, down 3.1% on the year.
Two things it is not. It is not a buy-versus-rent recommendation: that depends on mortgage rates, the tax treatment of the interest, and how long you stay, none of which is in here. And the two legs measure slightly different housing — ZHVI values the whole owner-occupied stock, ZORI tracks asking rents on units coming to market, which skew smaller and newer. The level is therefore approximate; the direction is the signal.
Source: Zillow Research, Zillow Home Value Index and Zillow Observed Rent Index, Seattle–Tacoma–Bellevue MSA. The ratio is ZHVI ÷ (ZORI × 12), computed from the two series at build time rather than stored. Auto-generated each build.
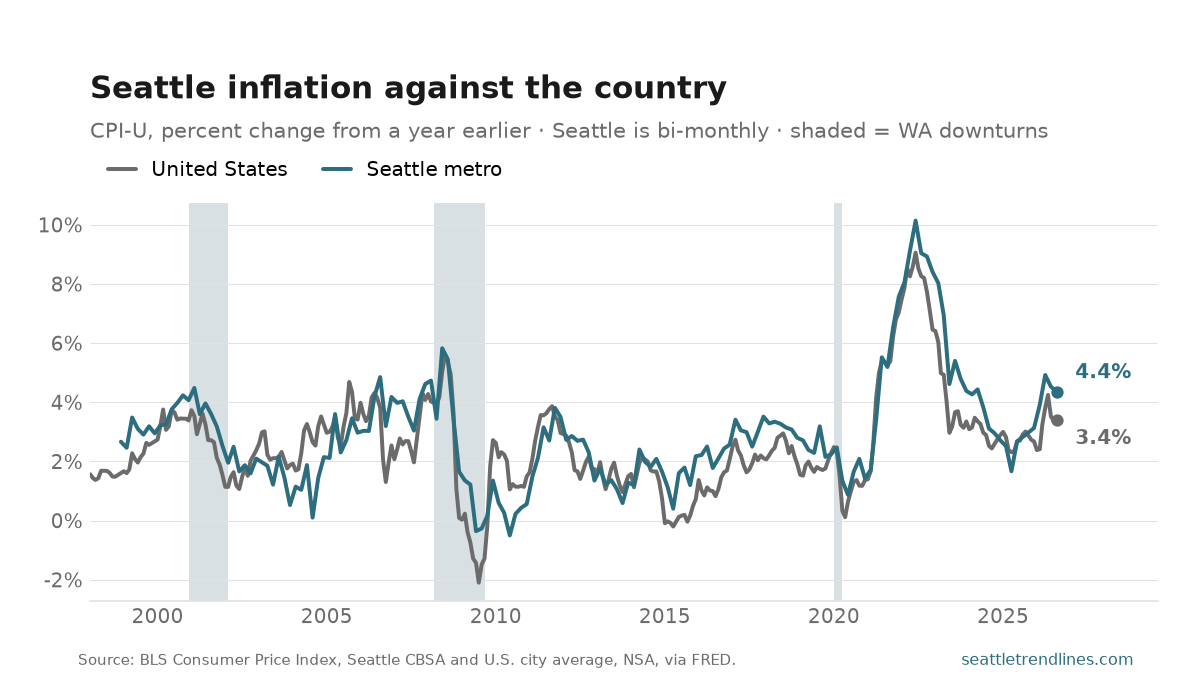
Seattle-metro prices were 4.4% higher than a year earlier in August 2026; nationally the figure was 3.4%. The gap is 1.0 points, with Seattle running hotter this month.
Most of what sets inflation is national — energy, vehicles, the money supply — so the two lines mostly move together and the interesting number is the distance between them. What opens that distance is housing: shelter is roughly a third of the basket and by far its most local component, which is why asking rents lead this gap by about a year.
BLS publishes the Seattle index for even months only, against a monthly national one, which is why this post runs every other month rather than every month: on the months in between there is no new local reading to report, only the one you are looking at here. The chart starts in 1998; the index itself goes back to 1914, when this was a different city.
Source: U.S. Bureau of Labor Statistics, Consumer Price Index for All Urban Consumers, Seattle–Tacoma–Bellevue CBSA (bi-monthly) and the U.S. city average, not seasonally adjusted, via FRED. Auto-generated each build.
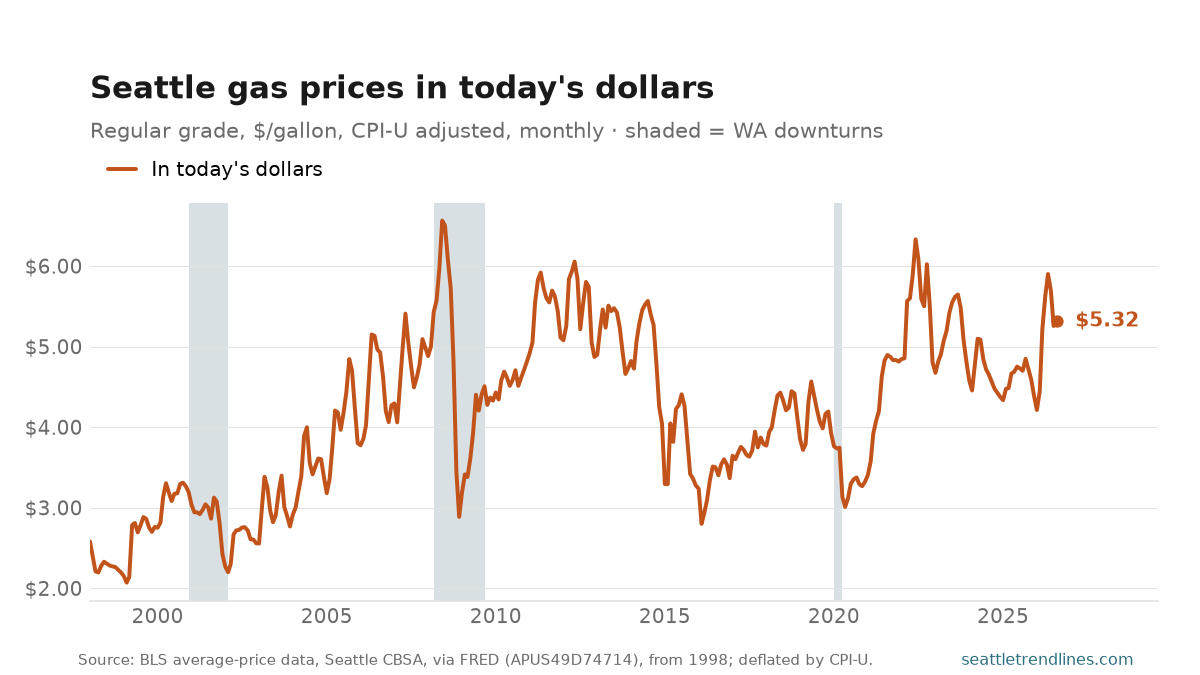
A gallon of regular cost $5.32 at the Seattle pump in August 2026. The line is deflated to the latest month, so today’s price is its own real price; the work is done on the old ones. A year ago’s gallon is $4.70 in today’s dollars, leaving this month up 13.1% in real terms.
The real number is the one that answers whether filling the tank actually costs more than it used to. Measured this way the record is $6.56 in June 2008, and today sits 19% below it — a very different sentence from the nominal series, which sets a new high every time the dollar shrinks.
Deflated by CPI-U, so “today’s dollars” means the latest period the price index covers. State fuel taxes and the clean-fuel standard are inside the number: this is what drivers paid, not what the crude cost. The line starts in January 1998, where BLS resumed collecting a Seattle price after roughly a decade of not publishing one.
Source: U.S. Bureau of Labor Statistics average-price series, regular unleaded gasoline, Seattle CBSA, via FRED APUS49D74714, deflated by CPI-U to the latest available period. Auto-generated each build.
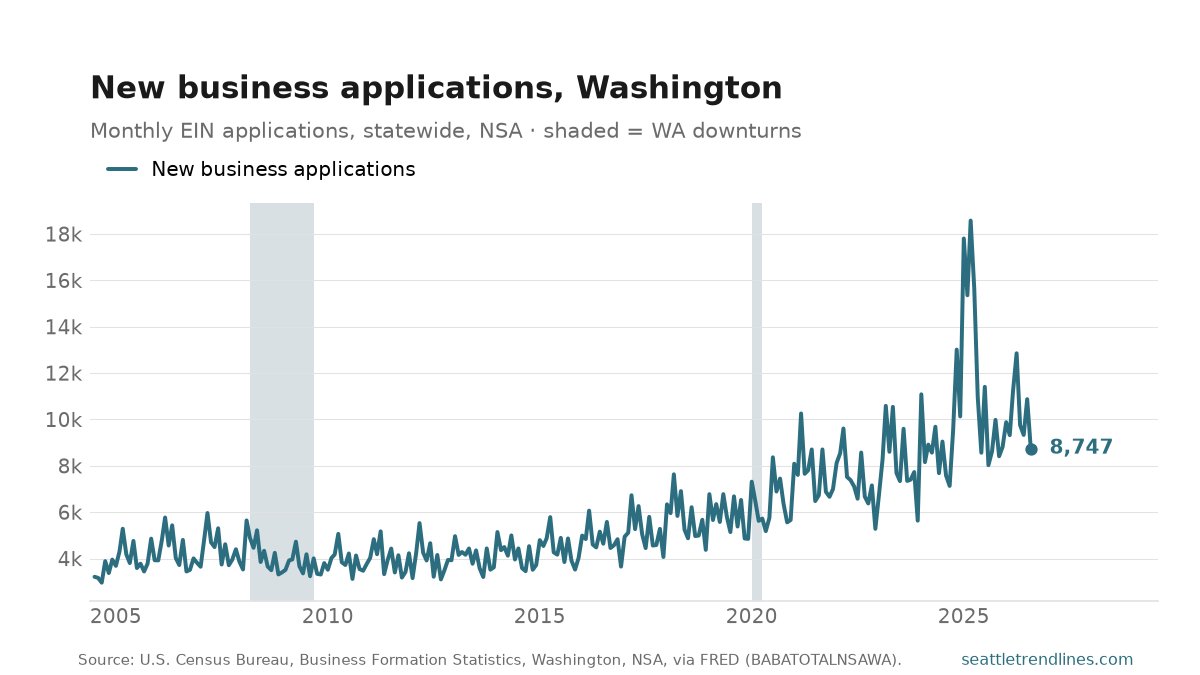
Washingtonians filed 8,747 new business applications in August 2026, up 8.9% from a year earlier. These are EIN filings, so the series measures intent to start a business rather than businesses that actually open — but it lands about 11 days after the month ends, which makes it one of the fastest real-activity readings available for the state. Note the step-change after 2020: application rates never returned to their pre-pandemic level.
Source: U.S. Census Bureau, Business Formation Statistics, business applications for Washington, monthly, not seasonally adjusted, via FRED BABATOTALNSAWA. Auto-generated each build.
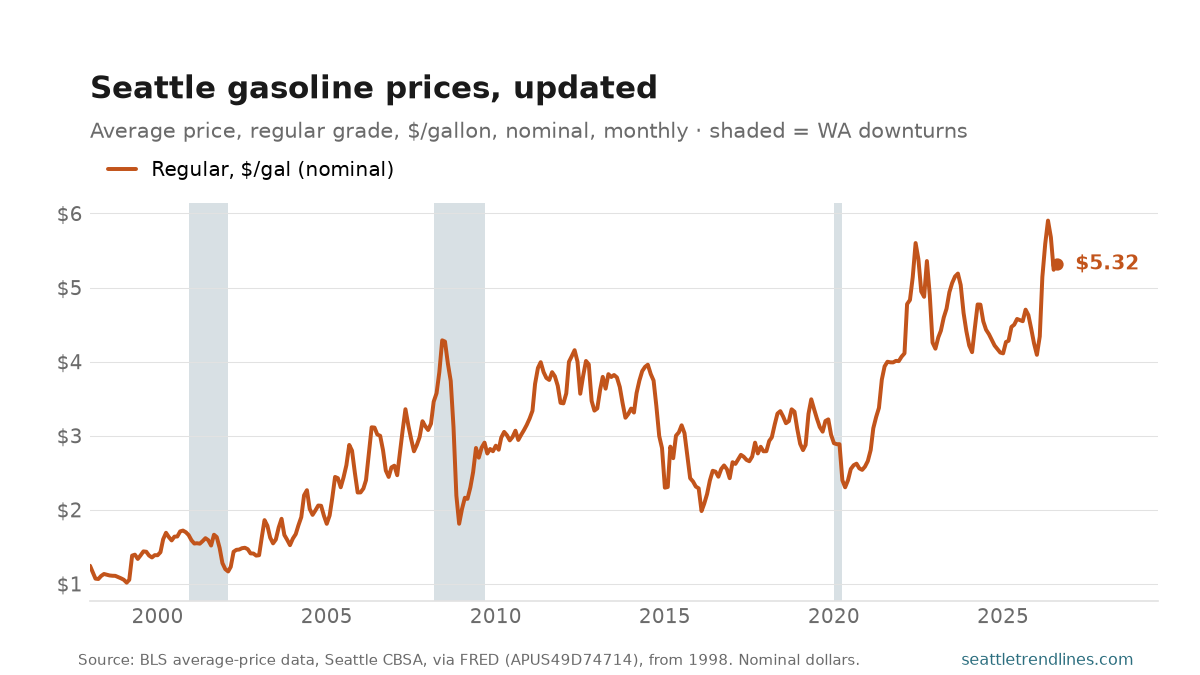
The Seattle-area average price of regular gasoline was $5.32 a gallon in August 2026, up 16.9% from a year earlier. Monthly update to the gas-price post; figures are nominal (not inflation-adjusted).
Source: U.S. Bureau of Labor Statistics average-price series, Seattle CBSA, via FRED (APUS49D74714), nominal dollars. Auto-generated each build.
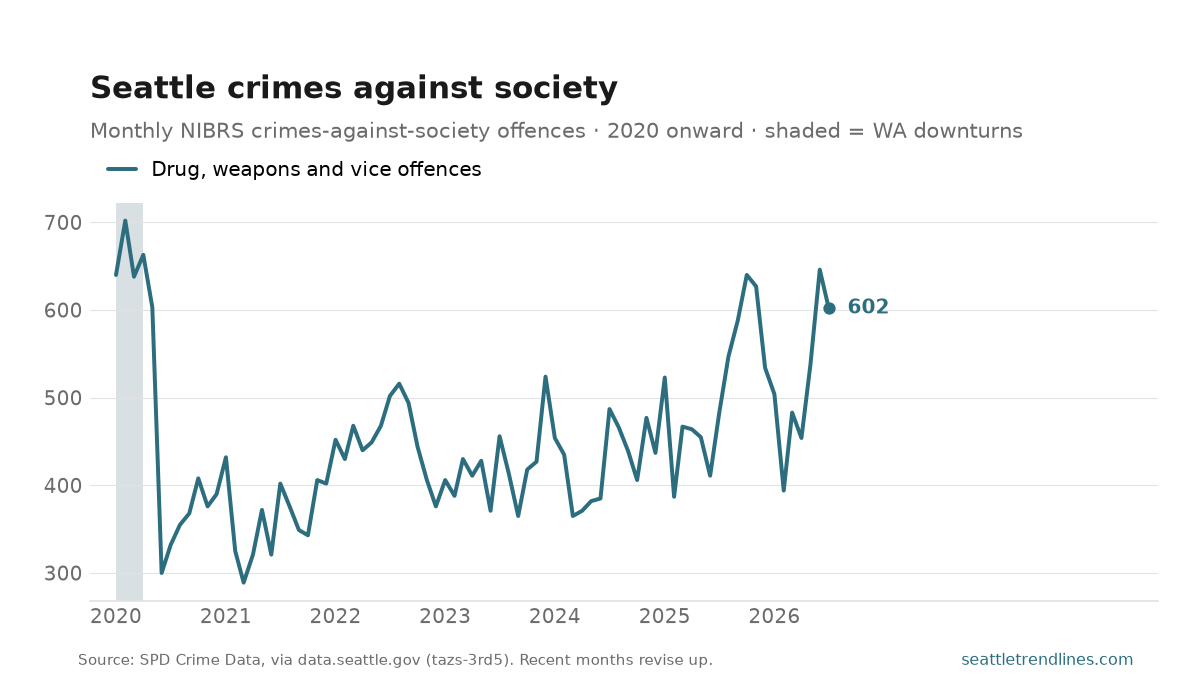
Seattle police recorded 602 crimes against society in July 2026, up 24.9% from a year earlier. This is NIBRS’s third category: drug and narcotics offences, weapons violations, prostitution, gambling — offences with no individual complainant.
That absence is what makes the series different from the other two, and it is why it belongs in its own post. Nobody calls 911 to report a drug offence against themselves, so this line measures enforcement, not incidence. It rises when a unit is staffed or a directive changes and falls when attention moves elsewhere, largely independent of how much of the underlying activity is happening. Read it as a record of what the department chose to do.
Reported offences, not incidents; recent months revise upward; chart starts in 2020 for the records-system change.
Source: Seattle Police Department, SPD Crime Data 2008-Present, via data.seattle.gov (Socrata tazs-3rd5), NIBRS crimes-against-society category. Auto-generated each build.
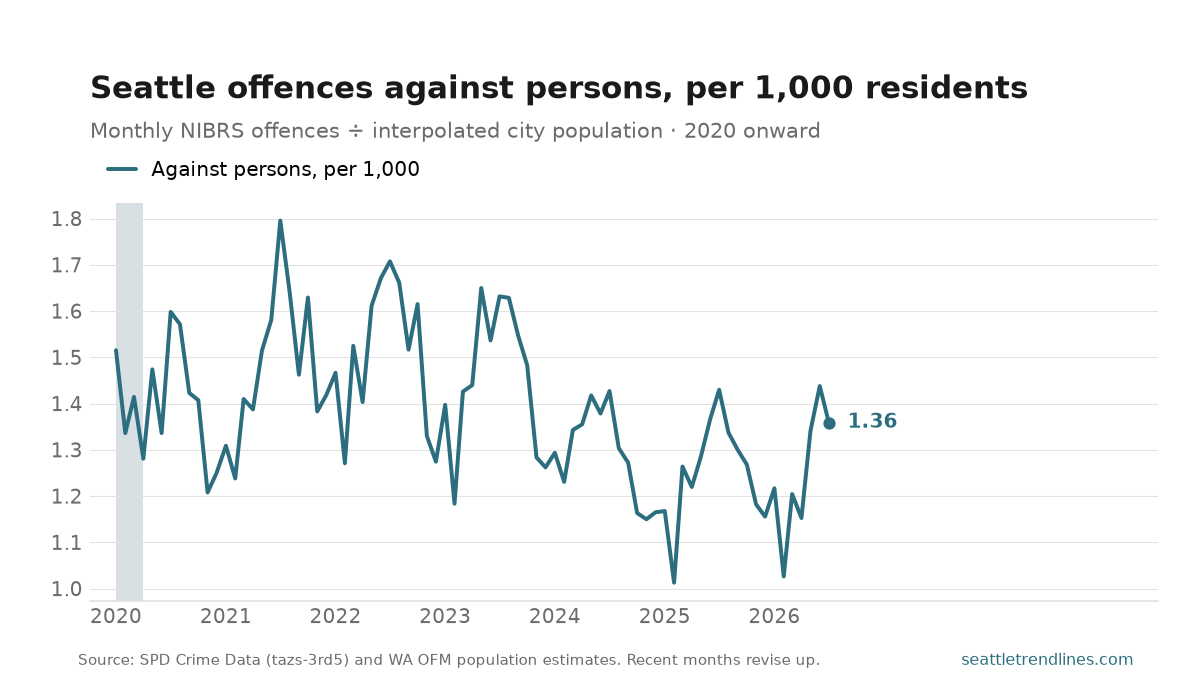
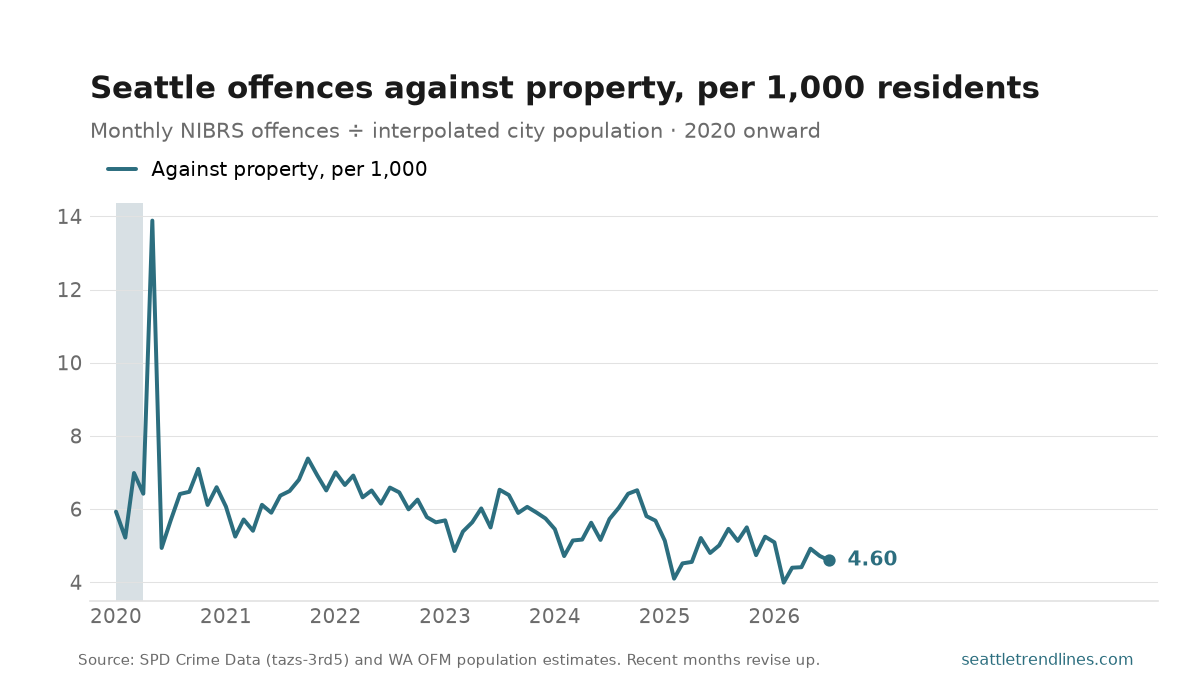
Seattle recorded 1.36 offences against persons per 1,000 residents in July 2026, and 4.60 offences against property per 1,000. In plain counts that is 1,119 offences against persons; the rate is the same fact with the city’s size divided out.
That division is the entire point of this post. Seattle has added well over a hundred thousand people since these records begin, so a count that rose ten per cent over a decade in which the population rose fifteen describes a city getting safer, and the monthly crime post — which charts counts, correctly, because that is what a monthly update reports — cannot show you that. Over the series the persons rate has run between 1.01 (February 2025) and 1.84 (August 2008) per thousand.
The spike early in the property series is May 2020, when downtown Seattle saw a single night of widespread break-ins during the George Floyd protests; property offences that month ran to roughly double any other month in the series. It is one event, not a trend, and it is left in rather than smoothed away.
Three caveats carry over from the count version and one is new. This is crime reported to police, so it moves with reporting behaviour. It counts offences, not incidents. Recent months revise upward. And the denominator is Washington OFM’s April 1 population estimate — one figure a year — interpolated in a straight line between estimates, because treating it as a step would put a false annual sawtooth into every rate on this page.
Sources: Seattle Police Department, SPD Crime Data 2008-Present, via data.seattle.gov (Socrata tazs-3rd5); Washington State Office of Financial Management April 1 population estimates for the city of Seattle, interpolated to monthly. Auto-generated each build.
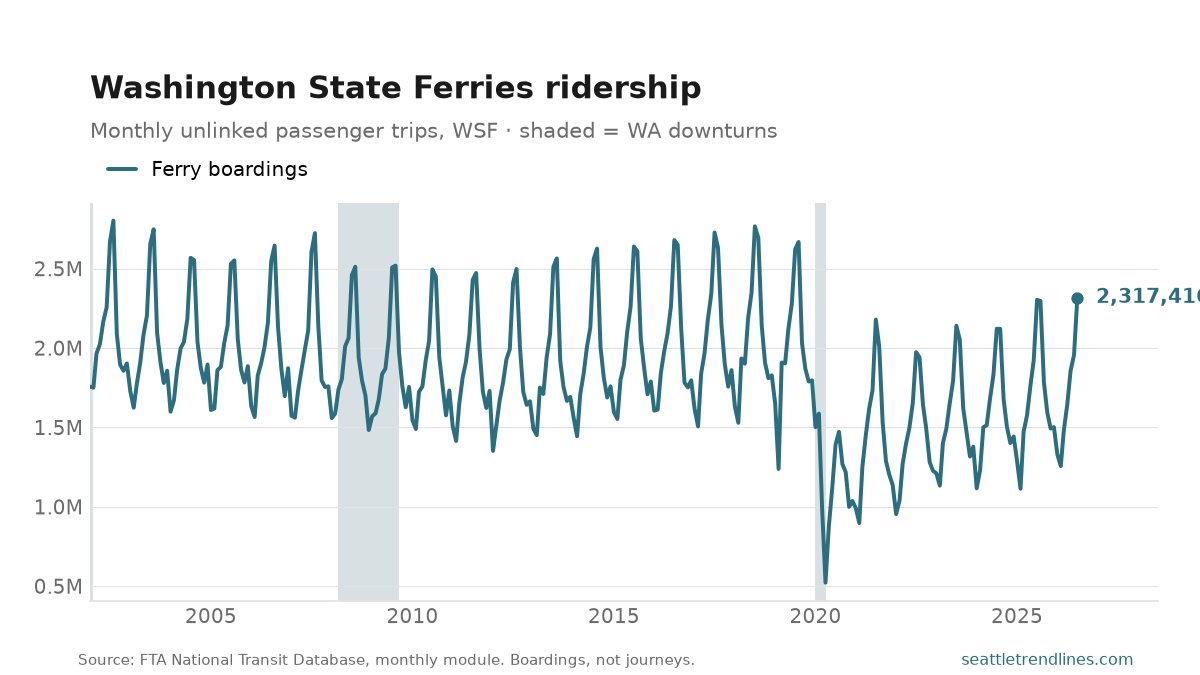
Washington State Ferries carried 2,317,416 passengers in July 2026, up 0.6% from a year earlier. The system swings hard with the season — from 522,473 in April 2020 to 2,803,031 in August 2002 — so the year-over-year figure is the one that means anything.
It is the largest ferry system in the United States and, unlike every other service charted here, it is simultaneously a commuter railway and a tourist attraction: the winter floor is people going to work on Bainbridge and Vashon, and the summer peak is everyone else. That is what makes the seasonal amplitude worth watching in its own right — a summer that runs below the usual multiple of its winter is a tourism signal, not a commuting one.
The constraint on this system is increasingly boats and crews rather than demand: sailings have been cancelled or reduced in recent years for vessel availability and staffing, and a cancelled sailing shows up here as fewer riders. Read a fall as service before reading it as demand. Boardings, not journeys; not seasonally adjusted.
Source: Federal Transit Administration, National Transit Database monthly module, Washington State Ferries unlinked passenger trips. Auto-generated each build.
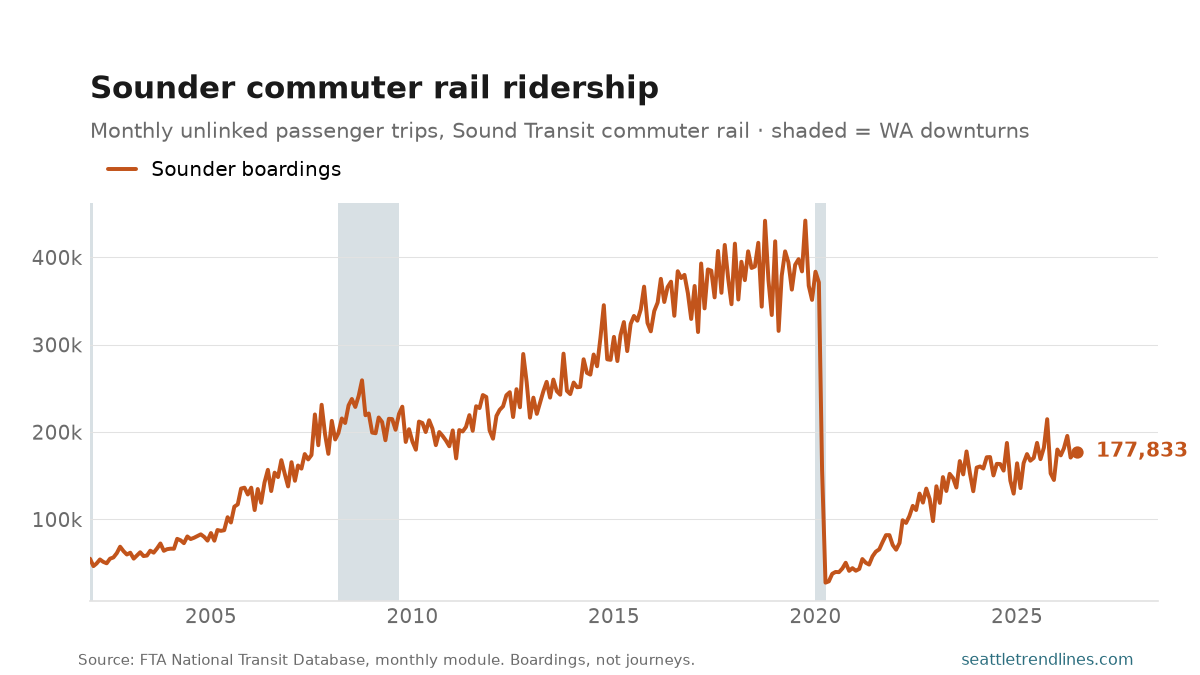
Sounder carried 177,833 boardings in July 2026, down 5.3% on the year — against a peak of 442,159 in October 2019, which makes it 60% below its high-water mark.
Sounder is the purest commuter service in the region and therefore the most exposed to remote work. It runs peak-direction trains on weekday mornings and evenings between Everett, Seattle and Lakewood, and almost nothing else — so unlike the bus or Link, it has essentially no non-commute ridership to cushion it. If you want a single number for how much the downtown office day has come back, this is the least ambiguous one on this site.
Boardings, not journeys. Service levels have changed over the period — trips added and, on the north line, cancelled for mudslides — so a fall is not always a fall in demand. Not seasonally adjusted.
Source: Federal Transit Administration, National Transit Database monthly module, Sound Transit commuter rail unlinked passenger trips. Auto-generated each build.
What’s coming on seattletrendlines.com the week of September 14–18 — 13 posts on the calendar.
Monday, September 14 — Sounder commuter rail, July 2026; Washington State Ferries ridership, July 2026.
Tuesday, September 15 — Seattle’s crime rate, July 2026; Seattle’s crimes against society, July 2026.
Wednesday, September 16 — Washington business applications, August 2026; How educated King County is, 2024 (pending — its numbers haven’t landed yet); Seattle gas prices, August 2026.
Thursday, September 17 — Working from home in King County, 2024 (pending — its numbers haven’t landed yet); Seattle inflation against the country, August 2026; Seattle gas in today’s dollars, August 2026.
Friday, September 18 — Buy or rent: the Seattle ratio, August 2026; King County’s changing population, 2024 (pending — its numbers haven’t landed yet); Seattle asking rents, August 2026.
This is the plan, not a promise. Every weekday post here is tied to a data release, and a release that slips takes its post with it — the post simply waits for the day its numbers land. A figure that arrives early, a revision worth writing about, or an unexpected story out of Seattle can just as easily add a post that isn’t on this list. Expect the week to look roughly like this, and expect at least one day of it not to.